
The EUR/USD currency pair
Technical indicators of the currency pair:
Prev Open: 1.13160
Open: 1.13681
% chg. over the last day: +0.50
Day’s range: 1.13799 – 1.13850
52 wk range: 1.1214 – 1.2557
EUR/USD is in a bullish mood. Yesterday, the quotes grew by more than 80 pips. The USD is under pressure due to the weak inflation reports. Positions should be opened from the currency support and resistance levels 1.13700 and 1.14000. Investors are waiting for the ECB meeting. You should keep an eye on its results, as well as the comments made by the ECB representatives.
The Economic News Feed for 13.12.2018:
ECB decision on key interest rate (EU) – 14:45 (GMT+2:00);
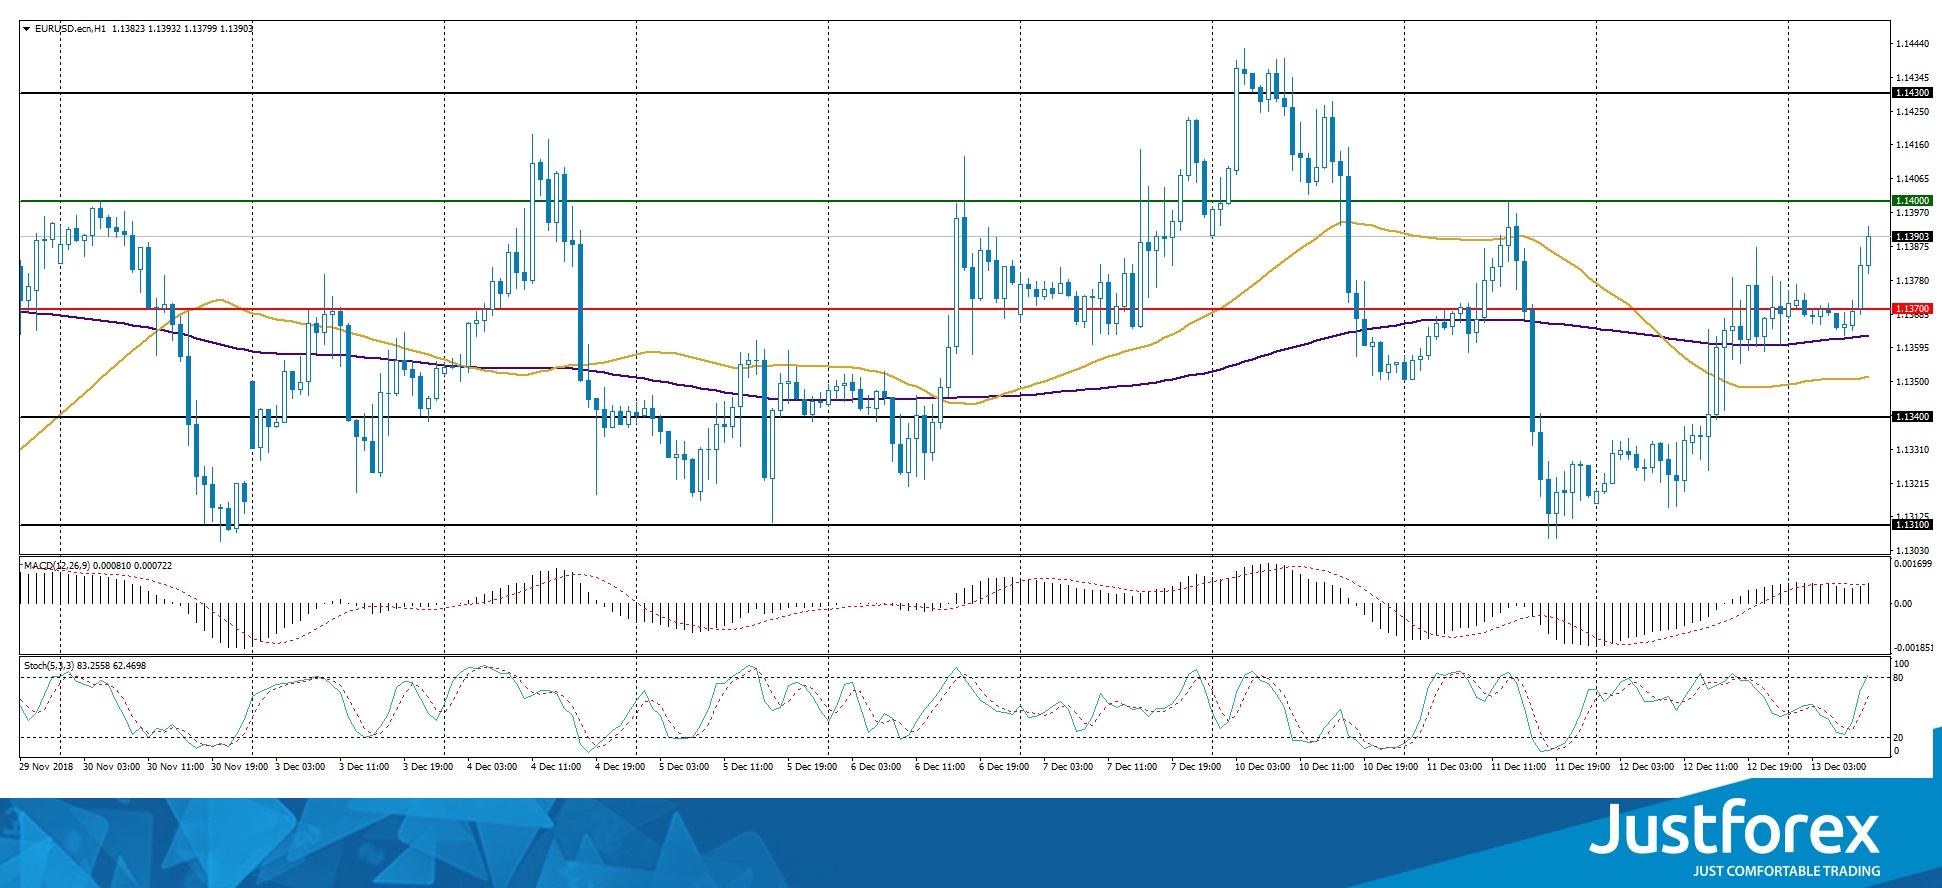
The price fixed below 50 MA and 200 MA which indicates the power of the buyers.
MACD is in the positive zone above the signal line, which gives a strong signal to buy EUR/USD.
The Stochastic Oscillator is in the neutral zone, the %K line is above the %D line, which indicates a bullish mood.
Trading recommendations
Support levels: 1.13700, 1.13400, 1.13100
Resistance levels: 1.14000, 1.14300
If the price fixes above the round 1.14000, expect further growth towards 1.14500-1.14750.
Alternatively, the quotes can descend to 1.13500-1.13300.
The GBP/USD currency pair
Technical indicators of the currency pair:
Prev Open: 1.24846
Open: 1.26245
% chg. over the last day: +1.11
Day’s range: 1.25984 – 1.26445
52 wk range: 1.2480 – 1.4378
GBP/USD is in the middle of an aggressive buyout. During the last two trading days the quotes grew by 170 pips. The Conservative Party of the UK voted on the confidence in the Prime Minister May. She was supported by 200 out of 317 conservatives and passed the votum of no confidence. The local support and resistance levels are 1.26400 and 1.27000. The trading instrument has prospects for growth.
The News Feed is calm for today.
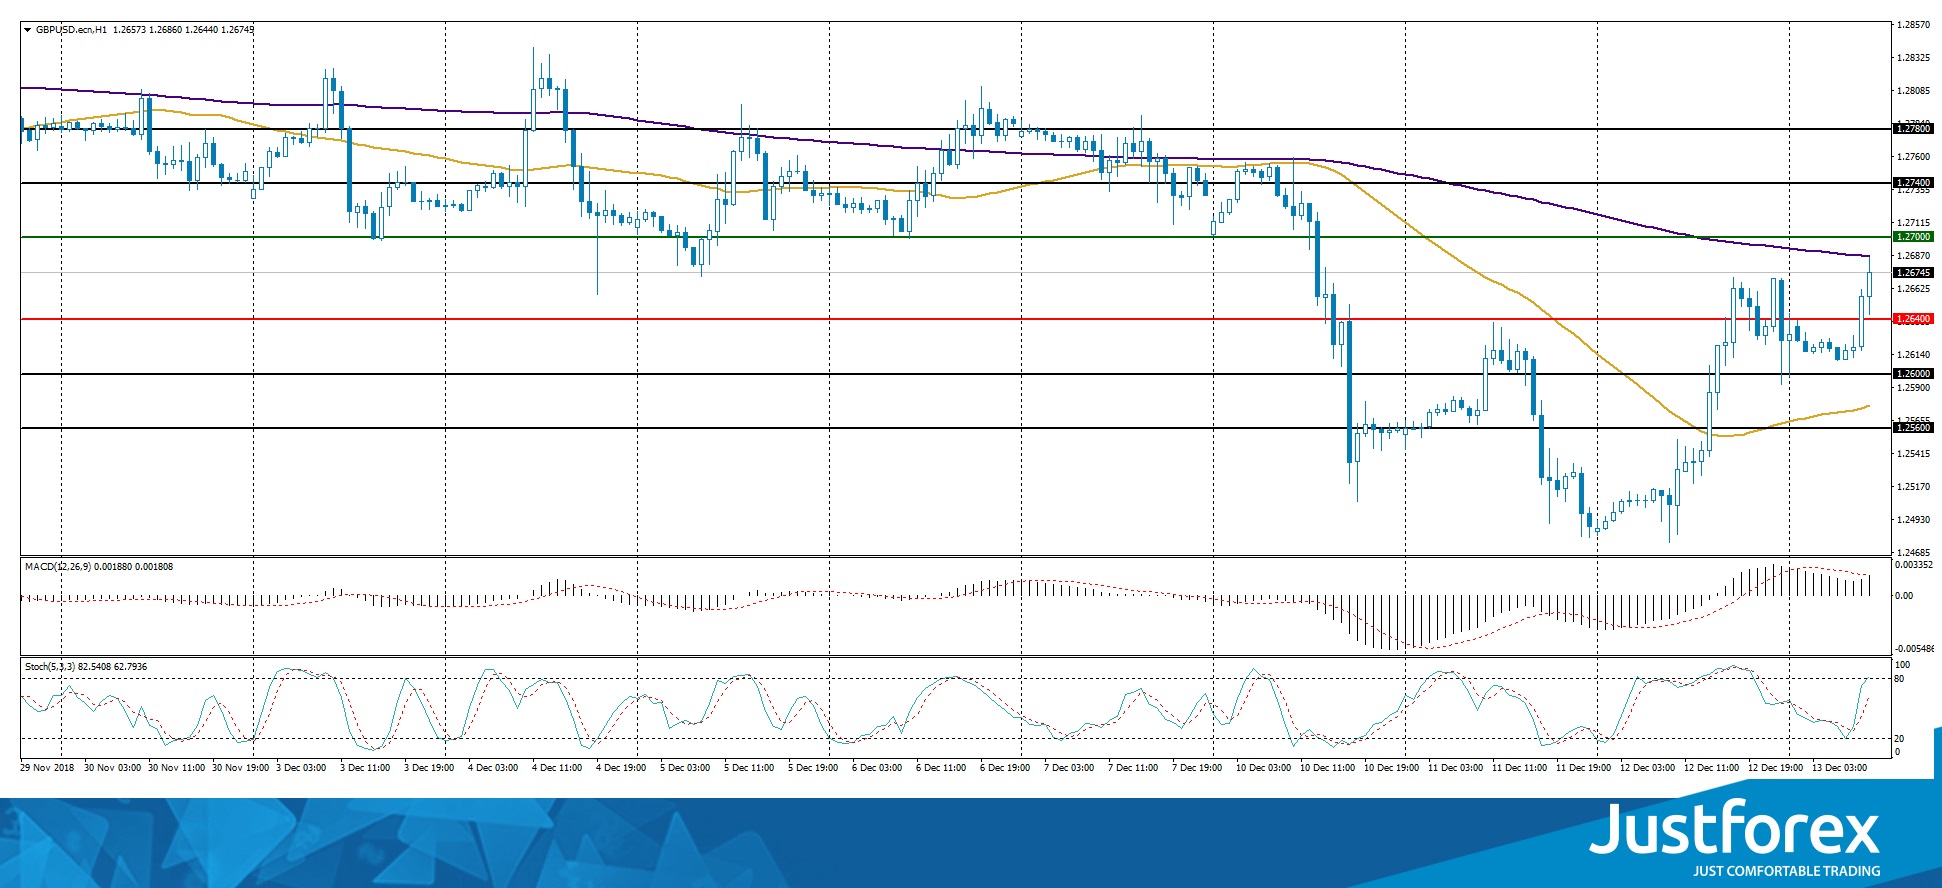
The price is testing 200 MA which is a strong dynamic resistance.
The MACD histogram is in the positive zone above the signal line, which give a strong signal to buy GBP/USD.
Stochastic Oscillator is near the overbought zone, the %K line is above %D line, which also indicated a bullish mood.
Trading recommendations
Support levels: 1.26400, 1.26000, 1.25600
Resistance levels: 1.27000, 1.27400, 1.27800
If the price fixes above the round 1.27000, the GBP/USD quotes are expected to keep growing towards 1.27400-1.27600.
Alternatively they can descend to 1.26000-1.25800.
The USD/CAD currency pair
Technical indicators of the currency pair:
Prev Open: 1.33892
Open: 1.33504
% chg. over the last day: -0.30
Day’s range: 1.33436 – 1.33573
52 wk range: 1.2248 – 1.3445
USD/CAD keeps trading in a flat. The technical picture is ambiguous. Positions should be opened from the local support and resistance levels 1.33300 and 1.33700. Keep an eye on the oil quotes dynamic. USD/CAD quotes have potential to descend after a long rally.
The News Feed for Canada is calm.
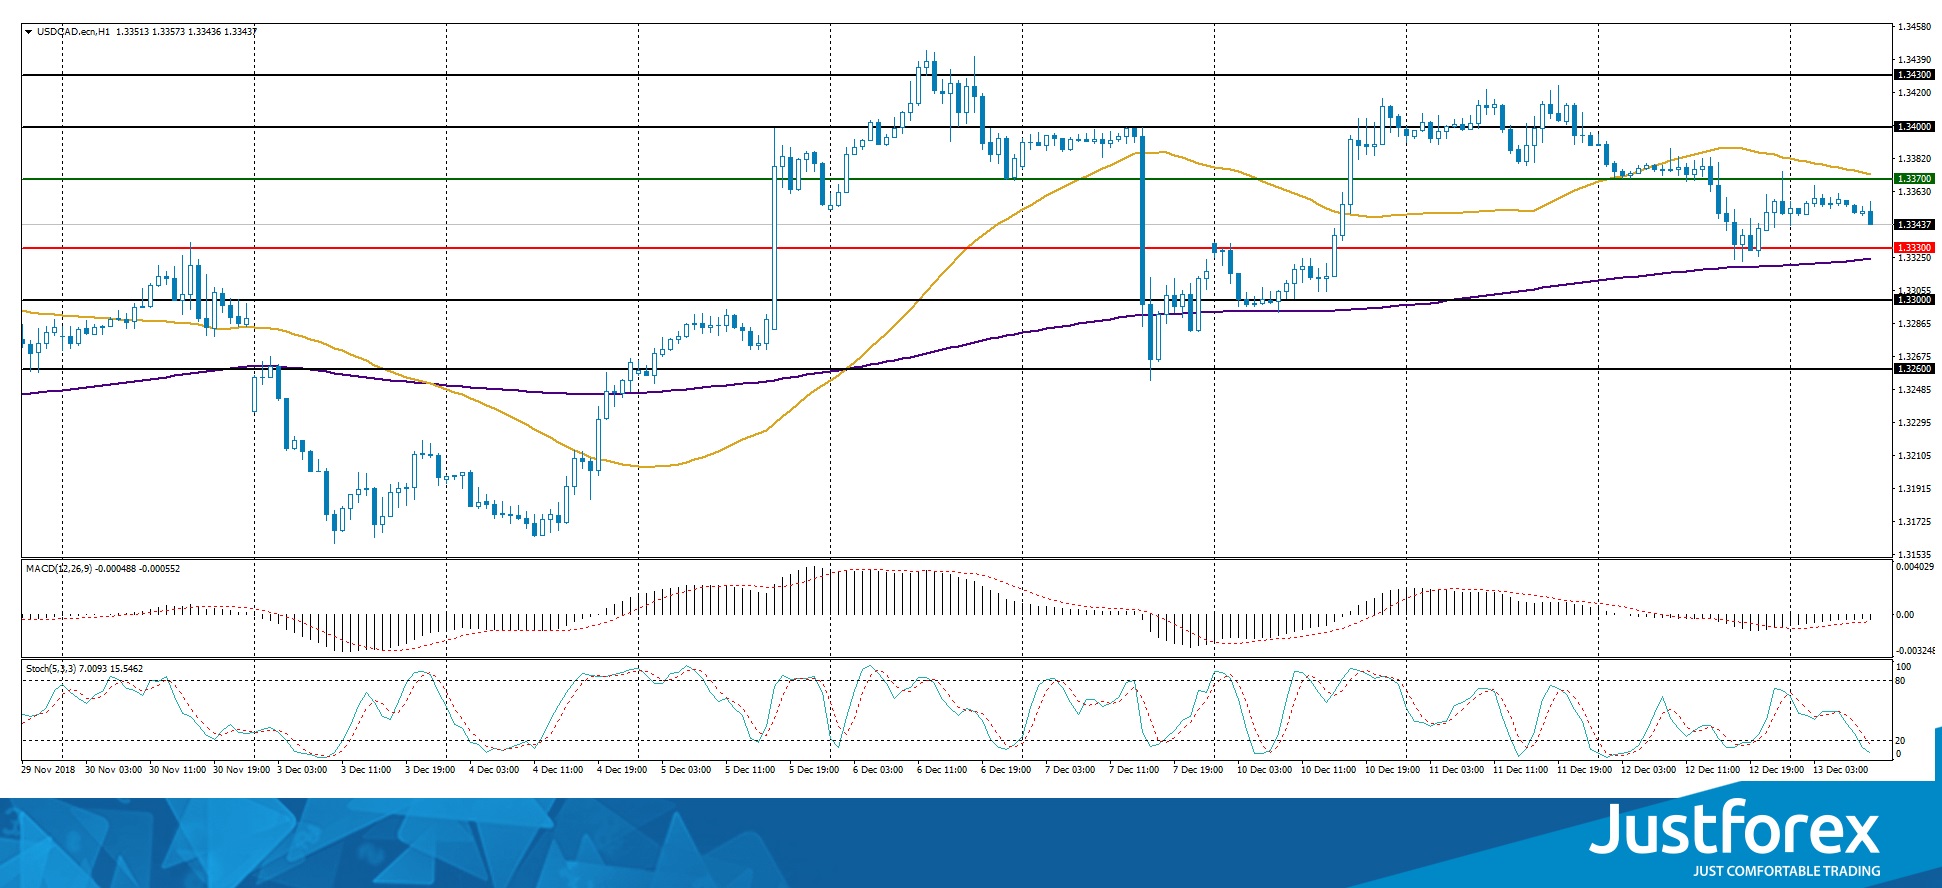
The indicators do not provide singals: the price is being traded between 50 MA and 200 MA.
The MACD histogram is in the negative zone which indicates a bearish mood.
The Stochastic Oscillator is in the oversold zone, the %K line is below the %D line, which points towards the decline of the USD/CAD quotes.
Trading recommendations
Support levels: 1.33300, 1.33000, 1.32600
Resistance levels: 1.33700, 1.34000, 1.34300
If the price fixes above 1.33700, USD/CAD quotes will grow toward 1.34000-1.34300.
Alternatively, if the price fixes below 1.33300,, we recommend looking for market entry points to open short positions. The movement is tending to 1.33000-1.32600.
The USD/JPY currency pair
Technical indicators of the currency pair:
Prev Open: 113.364
Open: 113.277
% chg. over the last day: -0.10
Day’s range: 113.441 – 113.470
52 wk range: 104.56 – 114.56
USD/JPY has a rather ambiguous dynamic. The financial market participants are waiting for additional drivers. Positions should be opened from the key support and resistance levels 113.300 and 113.550. Keep an eye on the US Treasury bonds yield.
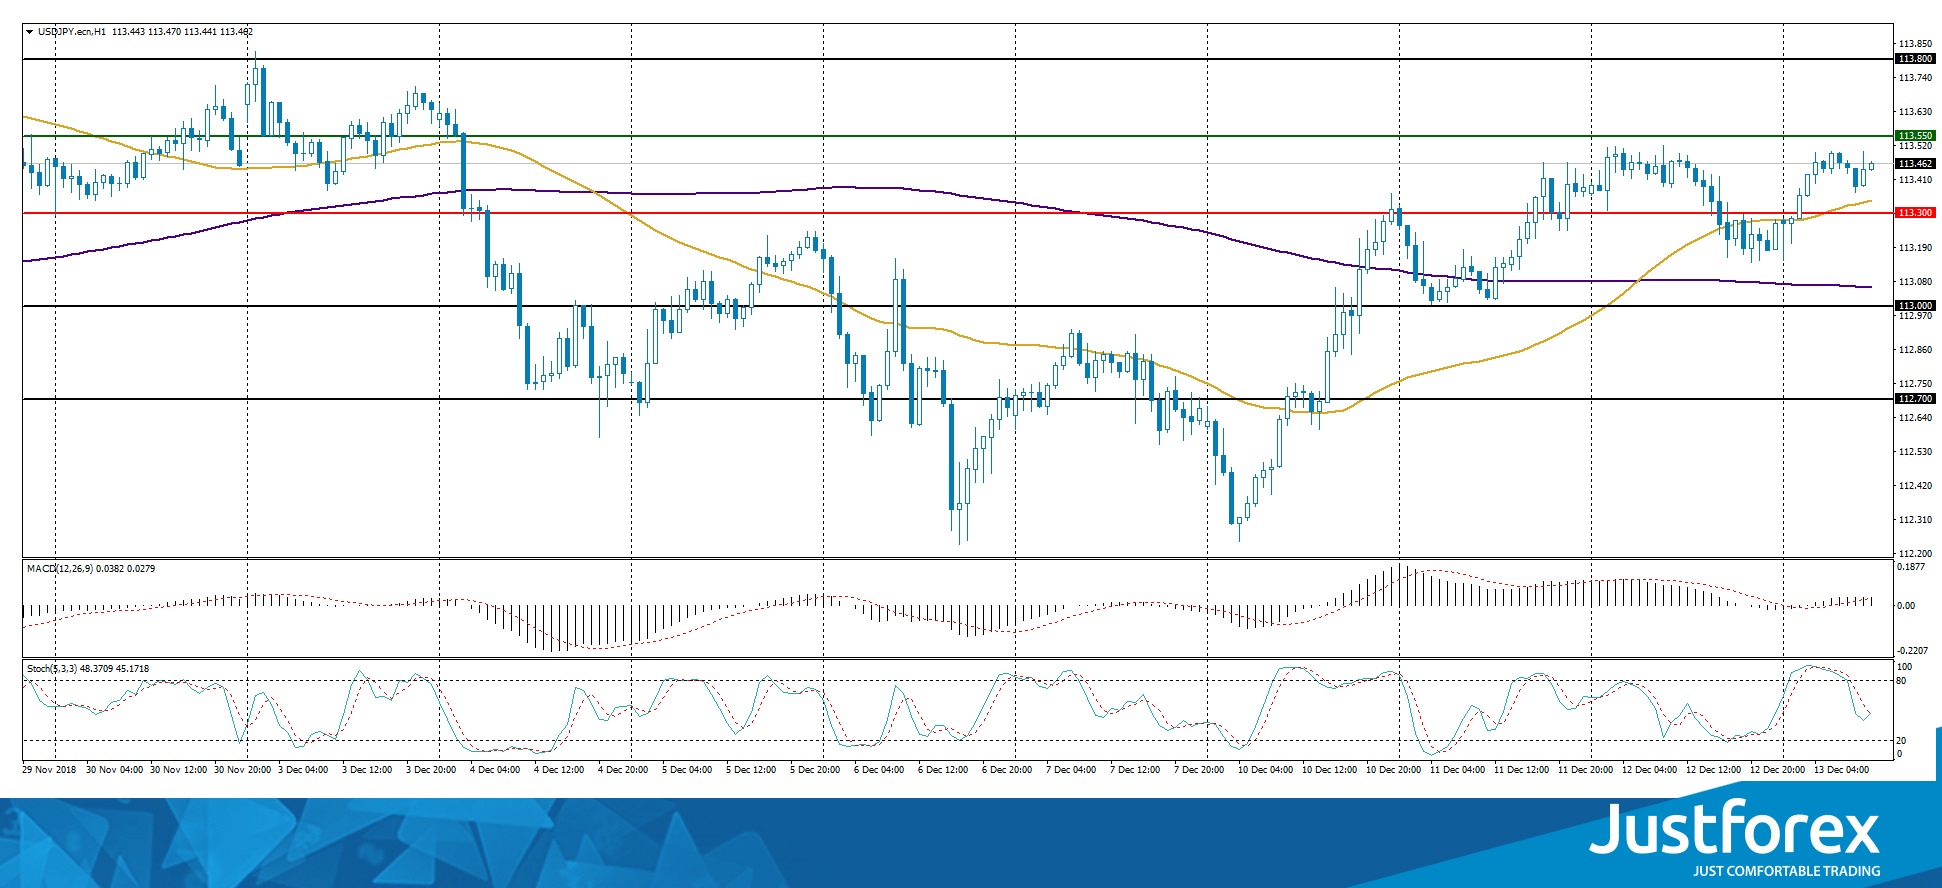
The price has fixed above the 200 MA and 50 MA which points towards a bullish mood.
The MACD histogram is in the positive zone which gives a strong signal to buy USD/JPY.
The Stochastic Oscillator is in the neutral zone, the %K line crosses the %D line. There are no signals at the moment.
Trading recommendations
Support levels: 113.300, 113.000, 112.700
Resistance levels: 113.550, 113.800
If the price fixes above the support level of 113.550,, it is necessary to consider buying USD/JPY. The movement is tending to 113.800-114.000.
An alternative could be the descend of the USD/JPY quotes to 113.000.


