
The EUR/USD currency pair
Technical indicators of the currency pair:
Prev Open: 1.13681
Open: 1.13595
% chg. over the last day: -0.04
Day’s range: 1.13363 – 1.13649
52 wk range: 1.1214 – 1.2557
The financial market participants are evaluating the results of the ECB meeting. The regulator, as expected, kept the fundamental parameters of the monetary policy at the previous levels. The Bank of Europe is concerned by the risks on the external markets, and therefore adjusted its EU GDP growth prospects for 2018-2019 to the worse. The EUR/USD currency pair is consolidating around 1.13400-1.13650. Positions should be opened from these levels. Important economic reports will be published today.
The Economic News Feed for 14.12.2018:
Manufactuting PMI in Germany (EU) – 10:30 (GMT+2:00);
Several Reports on Business Activity (EU) – 11:00 (GMT+2:00);
Retail Sales Reports (US) – 14:45 (GMT+2:00);
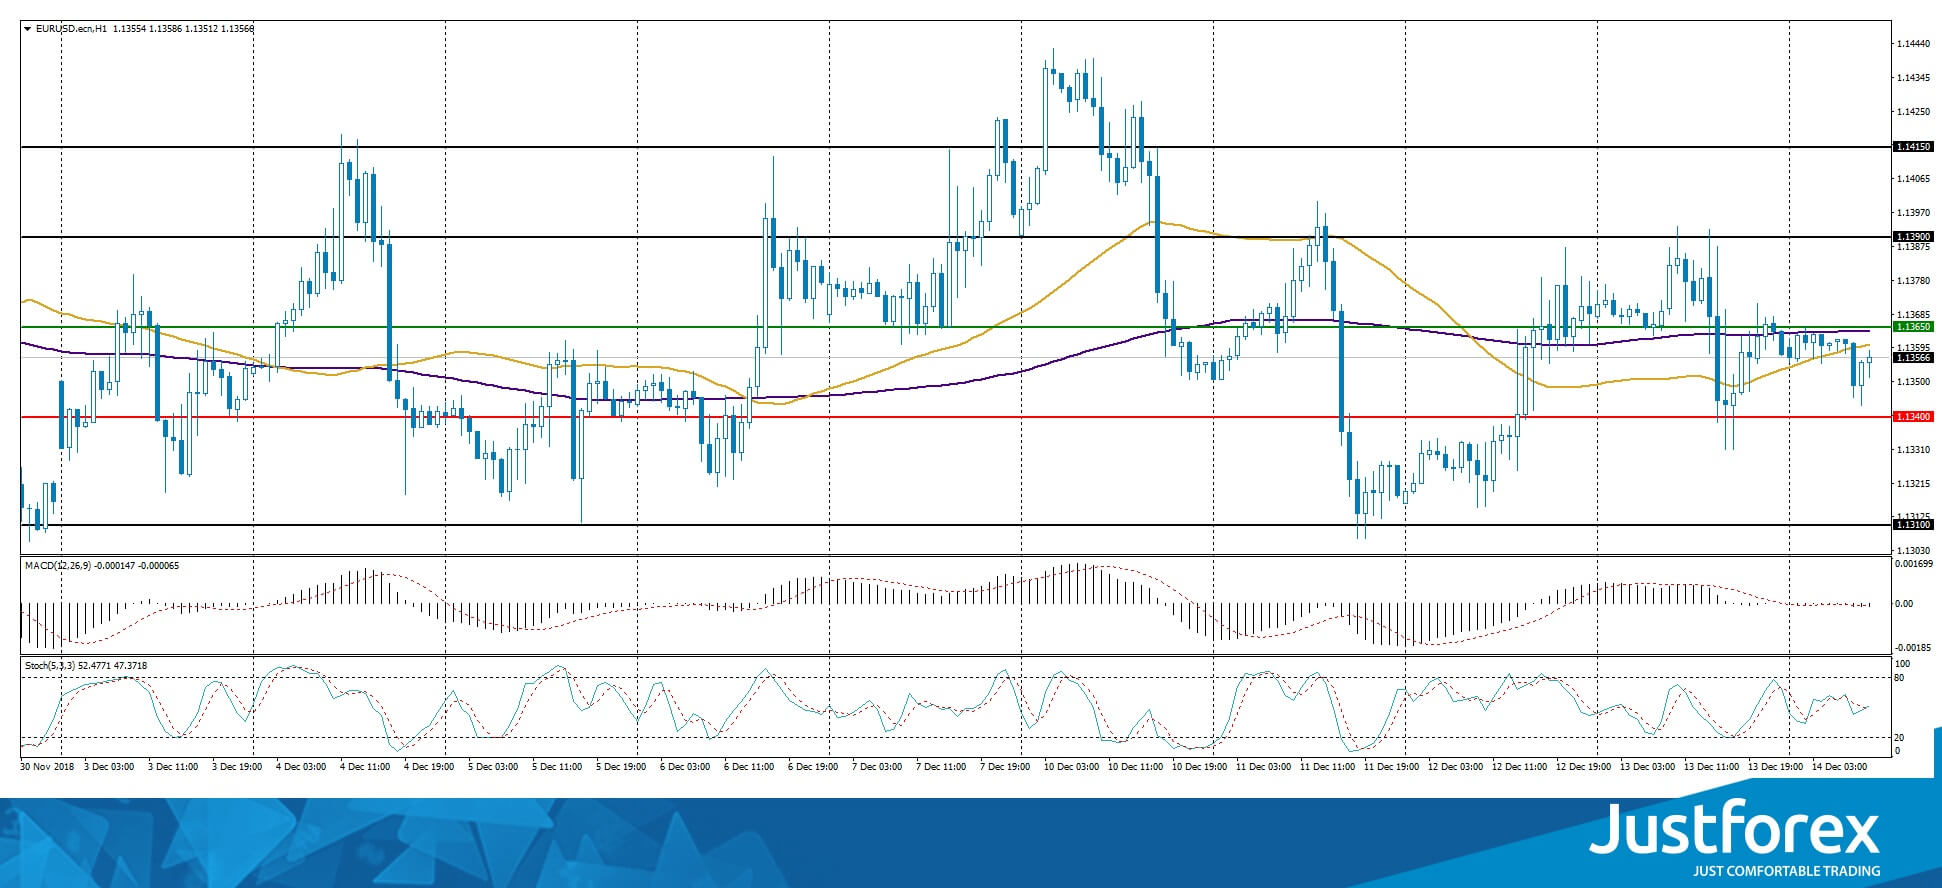
There are no precise signals: 50 MA has crossed 200 MA.
MACD histogram is around 0.
The Stochastic Oscillator is in the neutral zone, the %K line crosses the %D line. There are no signals at the moment.
Trading recommendations
Support levels: 1.13400, 1.13100
Resistance levels: 1.13650, 1.13900, 1.14150
If the price fixes below the support level of 1.13400, you should look into opening short positions. The price will move toward 1.13000-1.12800.
Alternatively, the quotes can grow to 1.13900-1.14150.
The GBP/USD currency pair
Technical indicators of the currency pair:
Prev Open: 1.26245
Open: 1.26325
% chg. over the last day: +0.18
Day’s range: 1.25742 – 1.26623
52 wk range: 1.2477 – 1.4378
GBP/USD has stabilized. The pound is trading in a flat. The local support and resistance levels are 1.25800 and 1.26300. The financial market participants are waiting for the relevant data regarding Brexit. The US Retail report is in the spotlight. You should open positions from the key levels.
The News Feed is calm for today.
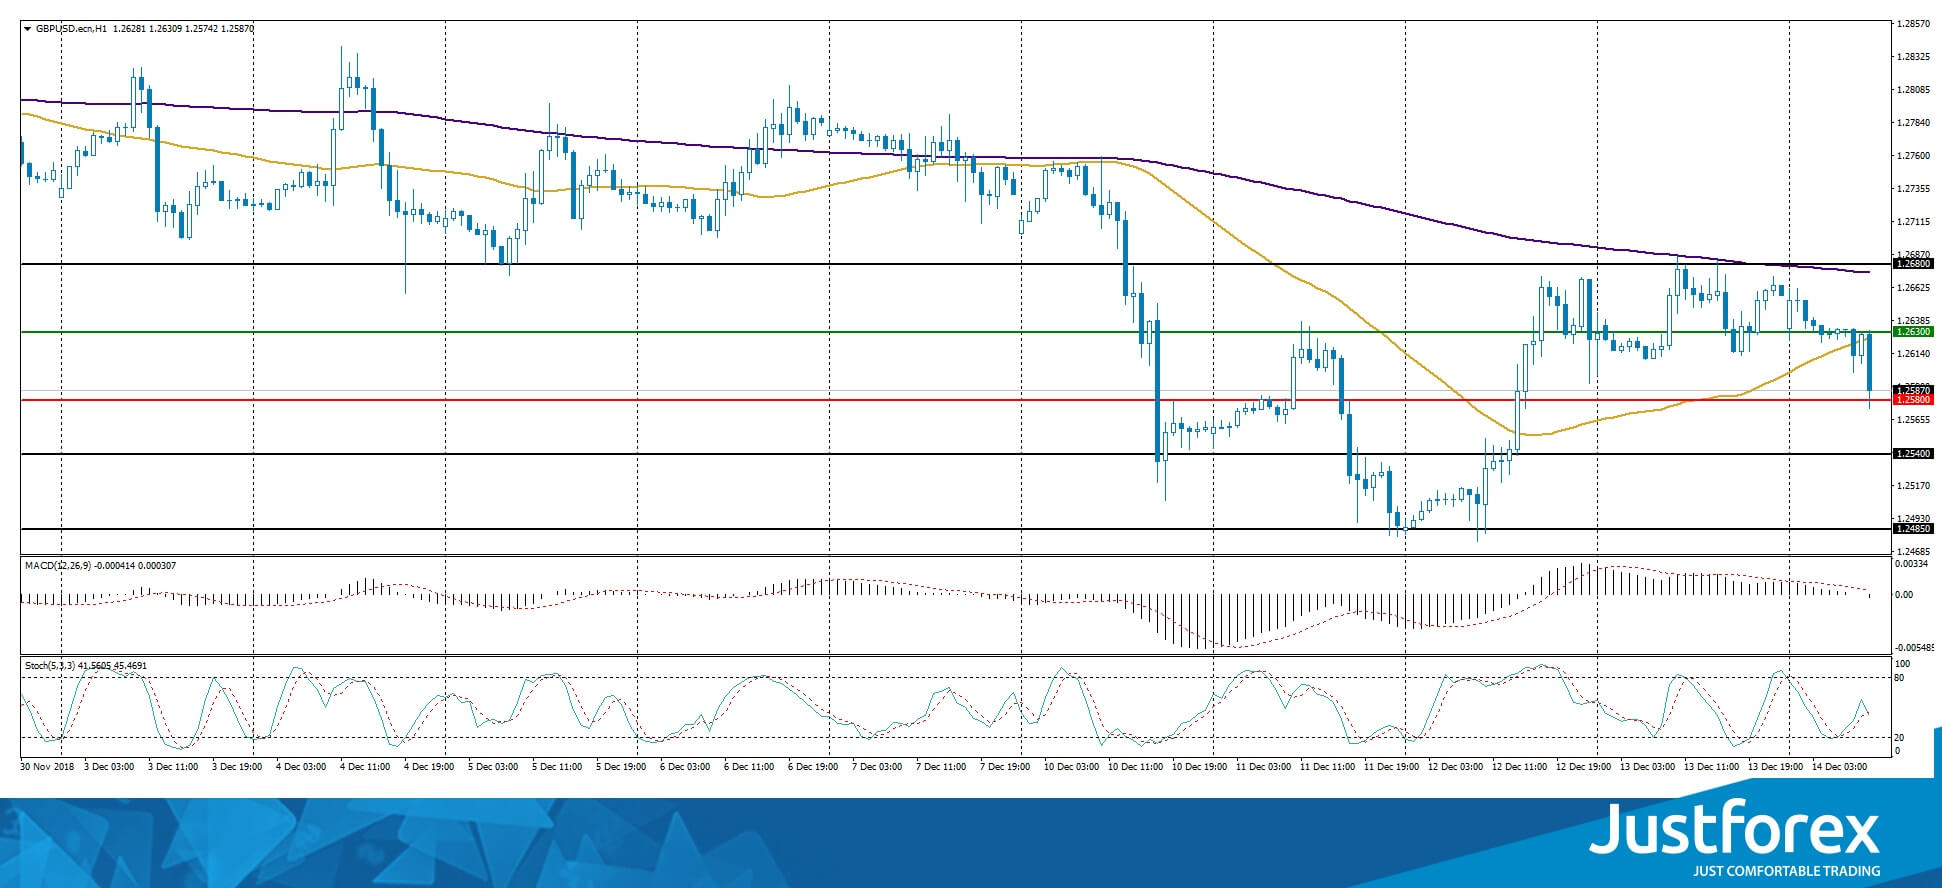
Indicators do not provide signals, the price has crossed 50 MA.
The MACD histogram is around 0.
Stochastic Oscillator is in the neutral zone, the %K line is crossing %D line. There are no signals at the moment.
Trading recommendations
Support levels: 1.25800, 1.25400, 1.24850
Resistance levels: 1.26300, 1.26800
If the price fixes below the round 1.25800, the GBP/USD quotes are expected to fall towards 1.25400-1.25000.
Alternatively they can rise to 1.26750-1.27000.
The USD/CAD currency pair
Technical indicators of the currency pair:
Prev Open: 1.33504
Open: 1.33452
% chg. over the last day: +0.01
Day’s range: 1.33452 – 1.33949
52 wk range: 1.2248 – 1.3445
The USD/CAD technical picture remains ambiguous. The CAD keeps trading in a long flat. The key support and resistance levels are 1.33600 and 1.34000 respectively. Important stats from the US are in the spotlight. You should keep an eye on the oil quotes dynamics. Positions should be opened from the key levels.
The News Feed for Canada is calm.
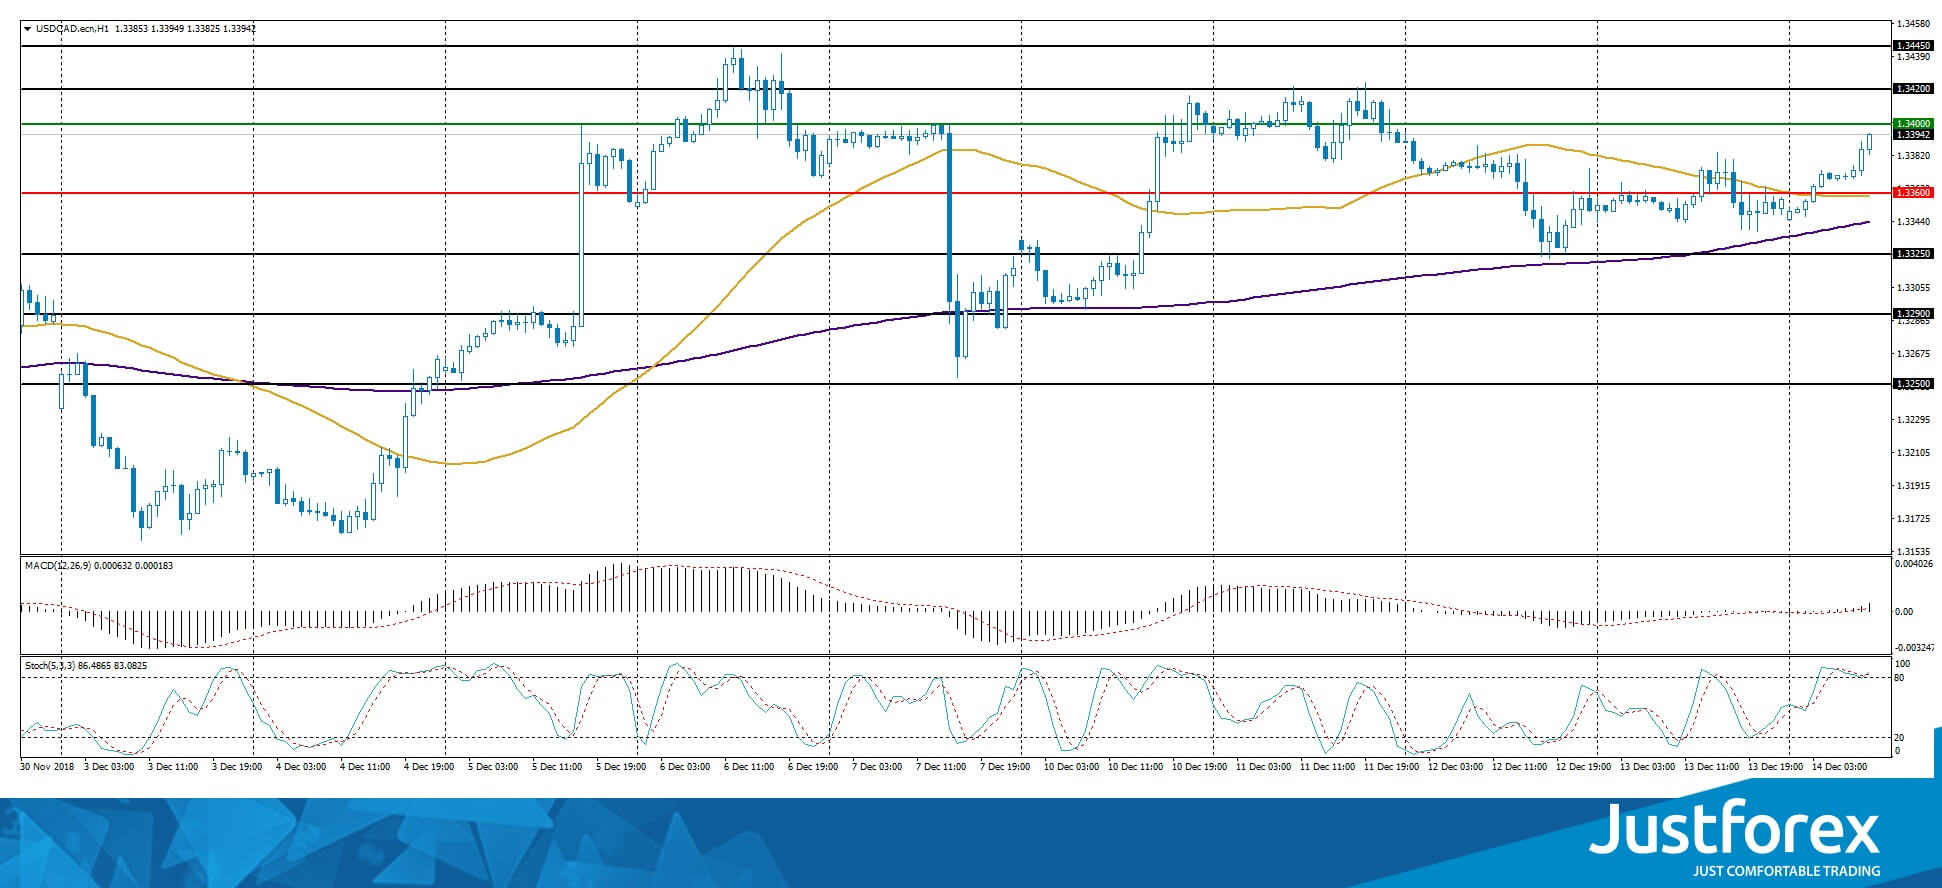
The price has fixed above 50 MA and 200 MA which indicates the power of the buyers.
The MACD histogram moved into the positive zone which indicates a bullish mood.
The Stochastic Oscillator is in the overbought zone, the %К line is crossing the %D line. There are no signals at the moment.
Trading recommendations
Support levels: 1.33600, 1.33250, 1.32900
Resistance levels: 1.34000, 1.34450
If the price fixes above 1.34000, you should consider entering the market with a long order. USD/CAD quotes will grow toward 1.34000-1.34300.
Alternatively, if the price fixes below 1.33600,, we recommend looking for market entry points to open short positions. The movement is tending to 1.33000.
The USD/JPY currency pair
Technical indicators of the currency pair:
Prev Open: 113.277
Open: 113.535
% chg. over the last day: +0.26
Day’s range: 113.423 – 113.652
52 wk range: 104.56 – 114.56
USD/JPY has been in a bullish mood for the last week. Right now the quotes are consolidating. The local support and resistance levels are 113.400 and 113.650. A technical correction is highly possible. You should keep an eye on the US economical news feed.
Tankan published a positive report during the Asian trading session.
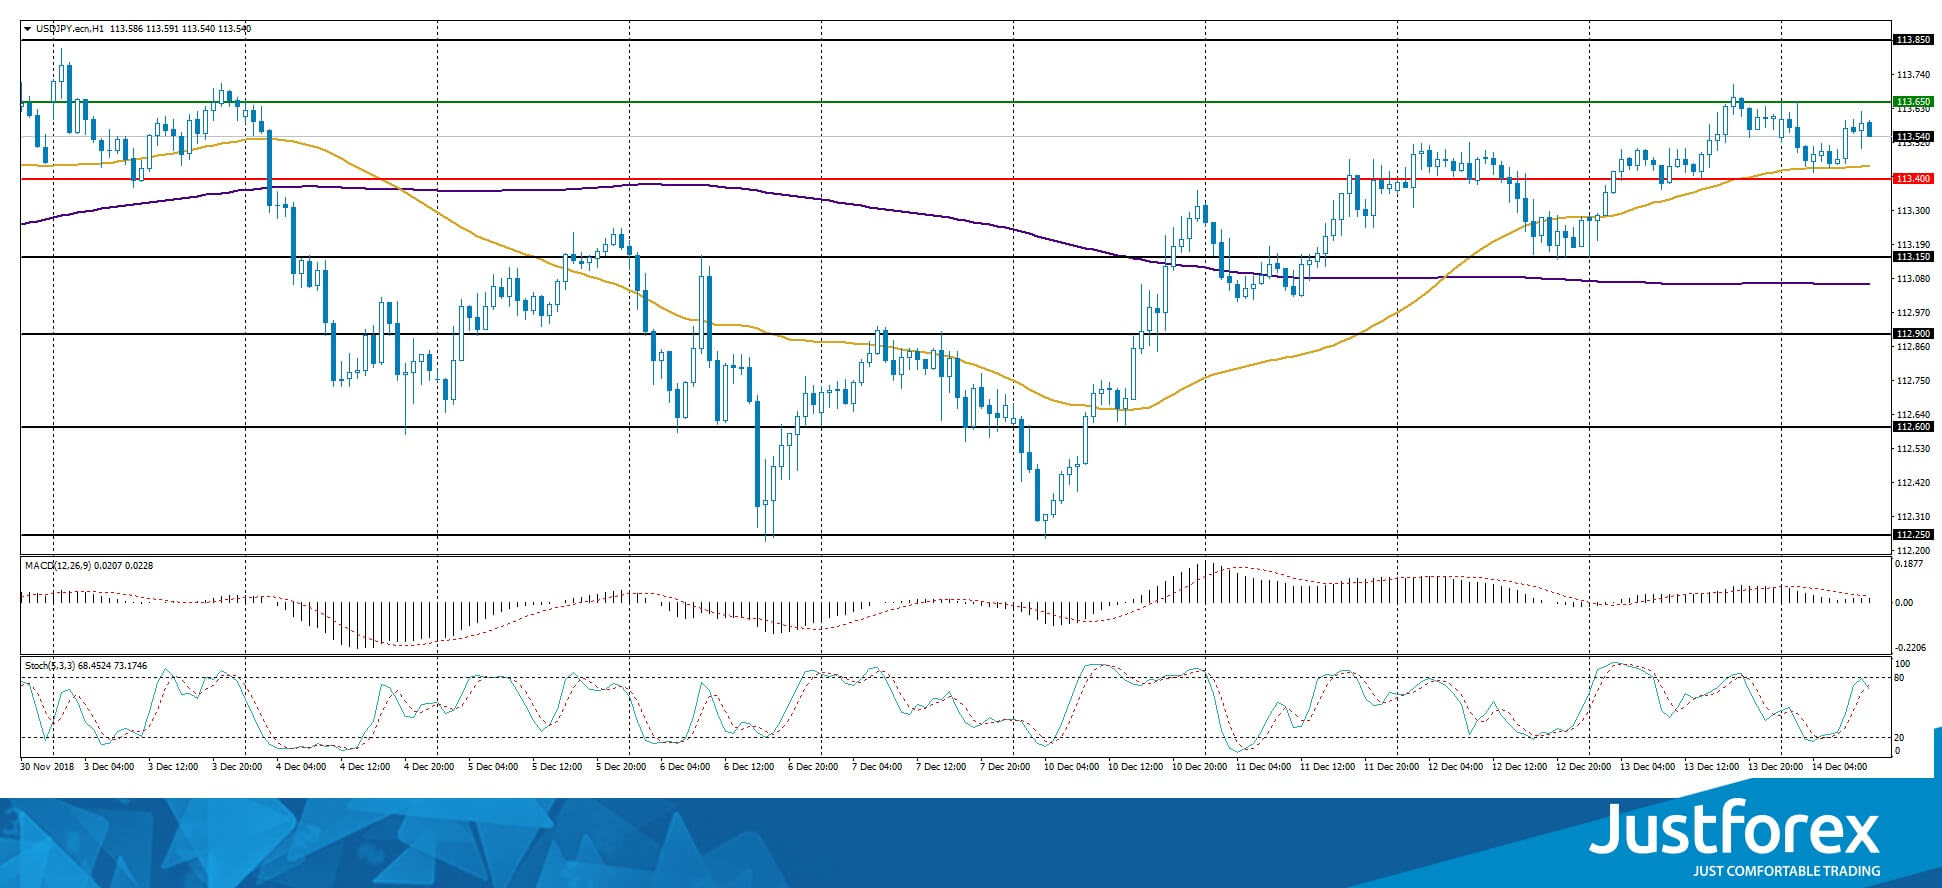
The price has fixed above the 200 MA and 50 MA which points towards a bullish mood.
The MACD histogram is closing in on 0.
The Stochastic Oscillator is in the neutral zone, the %K line crosses the %D line. There are no signals at the moment.
Trading recommendations
Support levels: 113.400, 113.150, 112.900
Resistance levels: 113.650, 113.850
If the price fixes above the support level of 113.650, it is necessary to consider buying USD/JPY. The movement is tending to 114.000.
Alternatively, the USD/JPY quotes can descend toward 113.150-113.000.


