
The EUR/USD currency pair
Technical indicators of the currency pair:
Prev Open: 1.14993
Open: 1.14581
% chg. over the last day: -0.27
Day’s range: 1.14650 – 1.14820
52 wk range: 1.1214 – 1.2557
On Friday the EUR/USD currency pair was in a bearish mood. The quotes lowered by more than 80 points. Important economic reports from the US were published, which have proven true the investors` expectations. For example, the basis consumer price index was 0.2% which fit the experts` expectations. Right now the trading instrument is consolidating in the 1.14500-1.14900 range, you should open positions from these levels.
The Economic News Feed for 14.01.2019:
Report on the Volume of Industrial Production in EU – 12:00 (GMT+2:00).
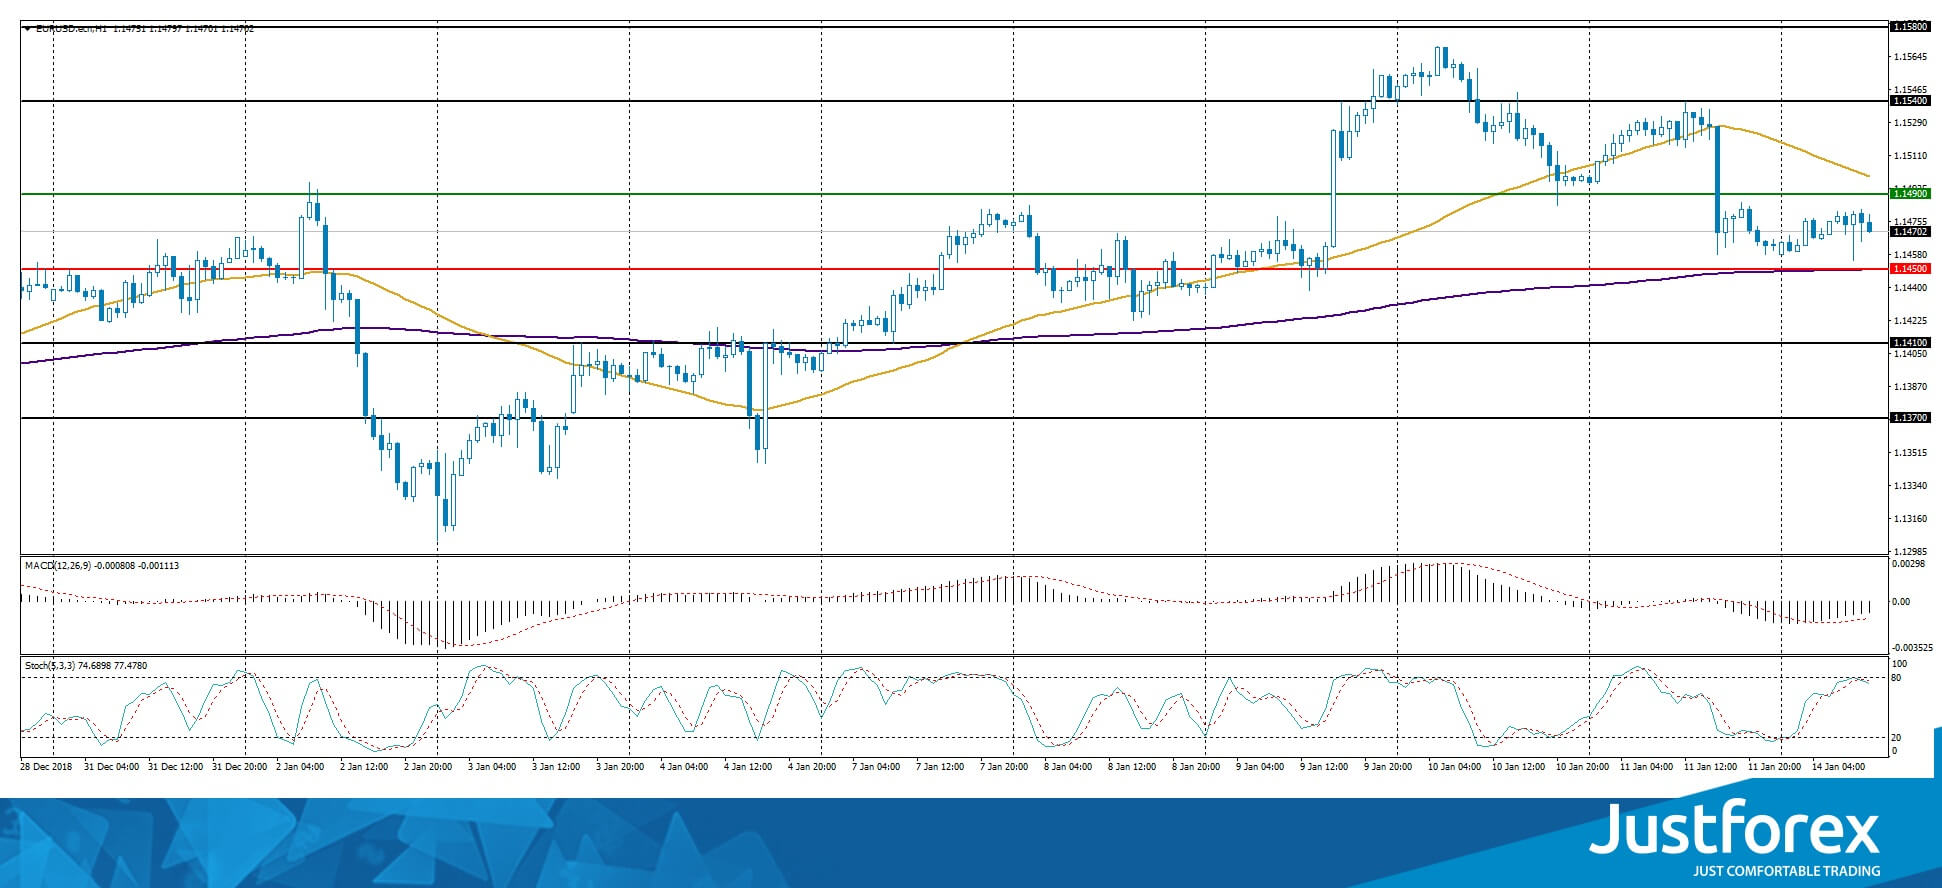
The indicators do not provide precise signals. The price is being traded between 50 MA and 200 MA.
The MACD histogram is in the negative zone but above the signal line which gives a weak signal to sell EUR/USD.
The Stochastic Oscillator is in the negative zone but above the signal line which gives a weak signal to sell EUR/USD.
Trading recommendations
Support levels: 1.14500, 1.14100, 1.13700
Resistance levels: 1.14900, 1.15400, 1.15800
If the price fixes below the local support level of 1.14500, consider selling EUR/USD. The movement will tend toward 1.14100-1.13700.
Alternatively the currency pair can grow toward 1.15400-1.15600.
The GBP/USD currency pair
Technical indicators of the currency pair:
Prev Open: 1.27372
Open: 1.28538
% chg. over the last day: +0.74
Day’s range: 1.28221 – 1.28315
52 wk range: 1.2438 – 1.4378
On Friday GBP/USD saw an aggressive buy-out after the publication of weak economic reports. The GDP (m/m) grew by 0.2% instead of 0.1%. The production volume in the processing industry lowered by 0.3% instead of growing by 0.4% as expected. The monthly GDP (3m/3m) grew by 0.3% which fits with the investors` expectations. The quotes grew by 100 points. Right now the key support and resistance levels are 1.28000 and 1.28600 respectively. You should open positions from these levels but expect a technical correction soon.
The Economic News Feed for 14.01.2019 is calm.
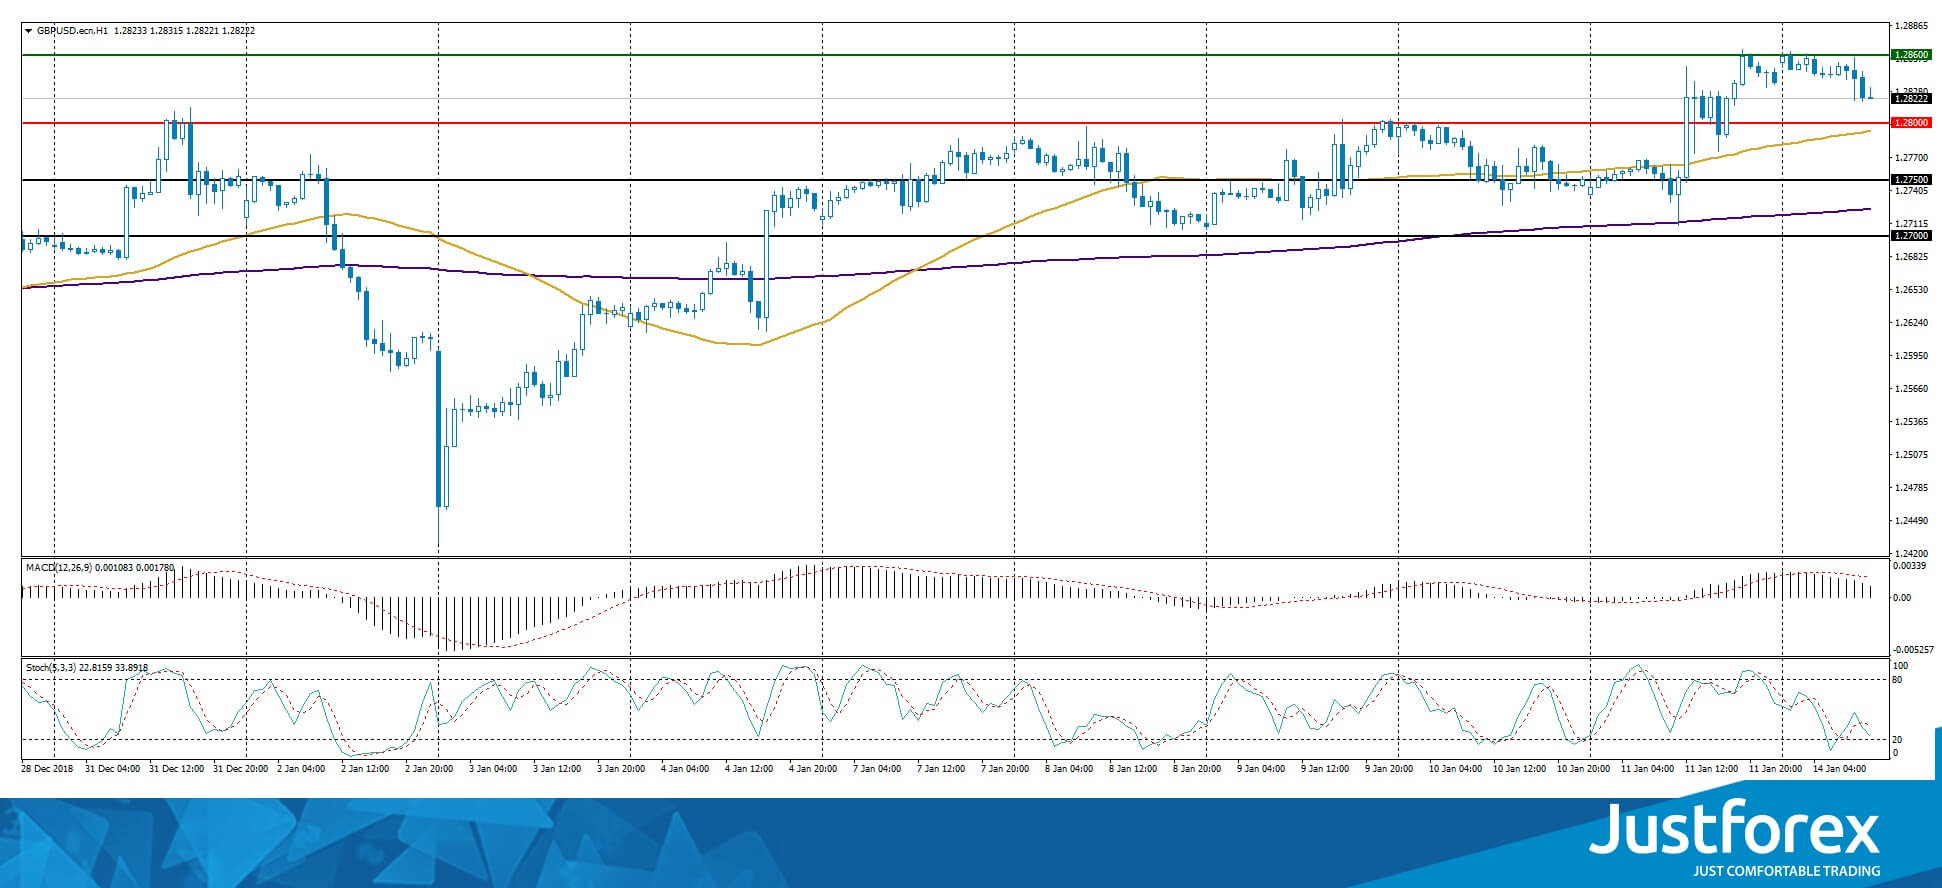
The indicators point toward the power of the buyers, the price fixed above 50 MA and 200 MA.
The MACD histogram is in the positive zone but below the signal line which gives a weak signal to buy GBP/USD.
The Stochastic Oscillator is in the neutral zone, the %K line is crossing the %D line. There are no precise signals.
Trading recommendations
Support levels: 1.28000, 1.27500, 1.27000
Resistance levels: 1.28600, 1.29000
If the price fixes below the round 1.28000 expect a technical correction of GBP/USD quotes toward 1.27500-1.27000.
Alternatively the currency pair grow toward 1.29000-1.29200.
The USD/CAD currency pair
Technical indicators of the currency pair:
Prev Open: 1.32311
Open: 1.32572
% chg. over the last day: +0.23
Day’s range: 1.32643 – 1.32742
52 wk range: 1.2248 – 1.3664
On Friday USD/CAD had shown a bullish mood. The trading instrument is moving sideways. The key support and resistance levels are 1.32500 and 1.33000 respectively. Positions should be opened from the key levels, expect further growth.
The Economic News Feed for 14.01.2019 is calm.
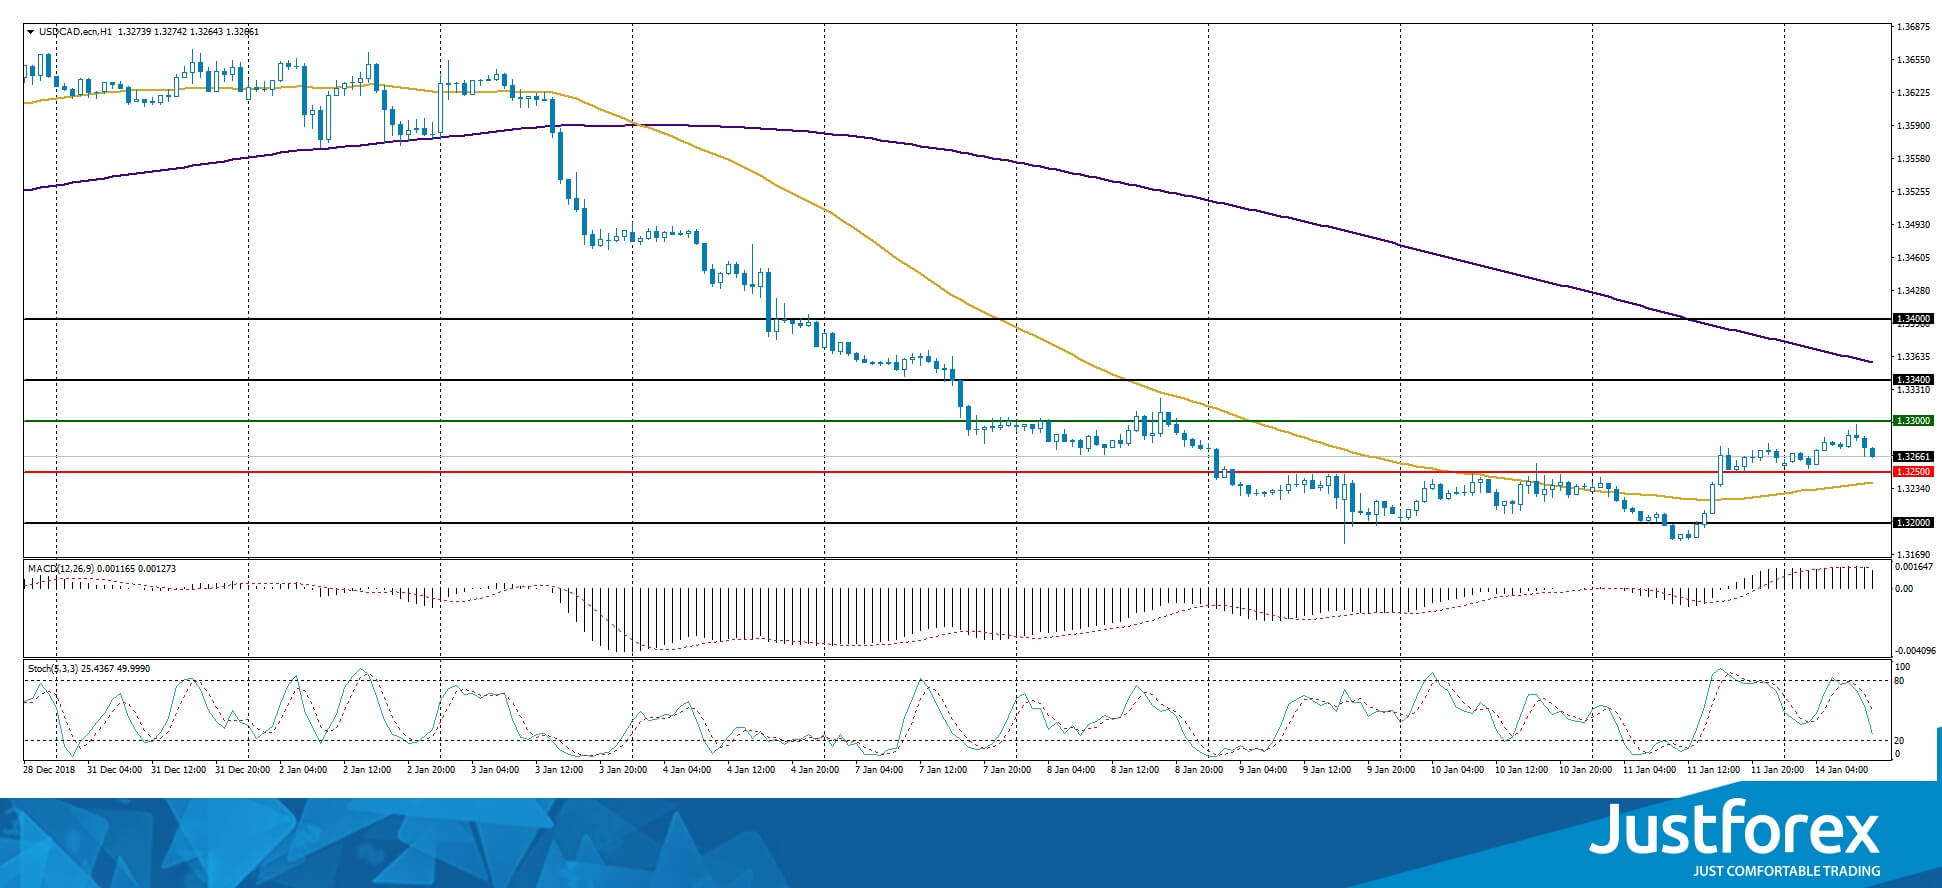
The price fixed between 50 MA and 200 MA which act as the dynamic levels of support and resistance.
The MACD histogram is in the positive zone but below the signal line which gives a weak signal to buy USD/CAD.
The Stochastic Oscillator is in the neutral zone, the %K line is below the %D line which gives a weak signal to sell USD/CAD.
Trading recommendations
Support levels: 1.32500, 1.32000
Resistance levels: 1.33000, 1.33400, 1.34000
If the price fixes above the round 1.33000 expect the quotes to grow toward 1.33400-1.33600.
Alternatively the currency pair can descend toward 1.32000-1.31700.
The USD/JPY currency pair
Technical indicators of the currency pair:
Prev Open: 108.425
Open: 108.512
% chg. over the last day: +0.12
Day’s range: 108.102 – 108.198
52 wk range: 104.56 – 114.56
The USD/JPY quotes are still showing an ambiguous technical picture. The quotes are consolidating around the 108.000-108.500 range. Investors are waiting for additional drivers. You should open the positions from the key levels.
The Economic News Feed for 14.01.2019 is calm.
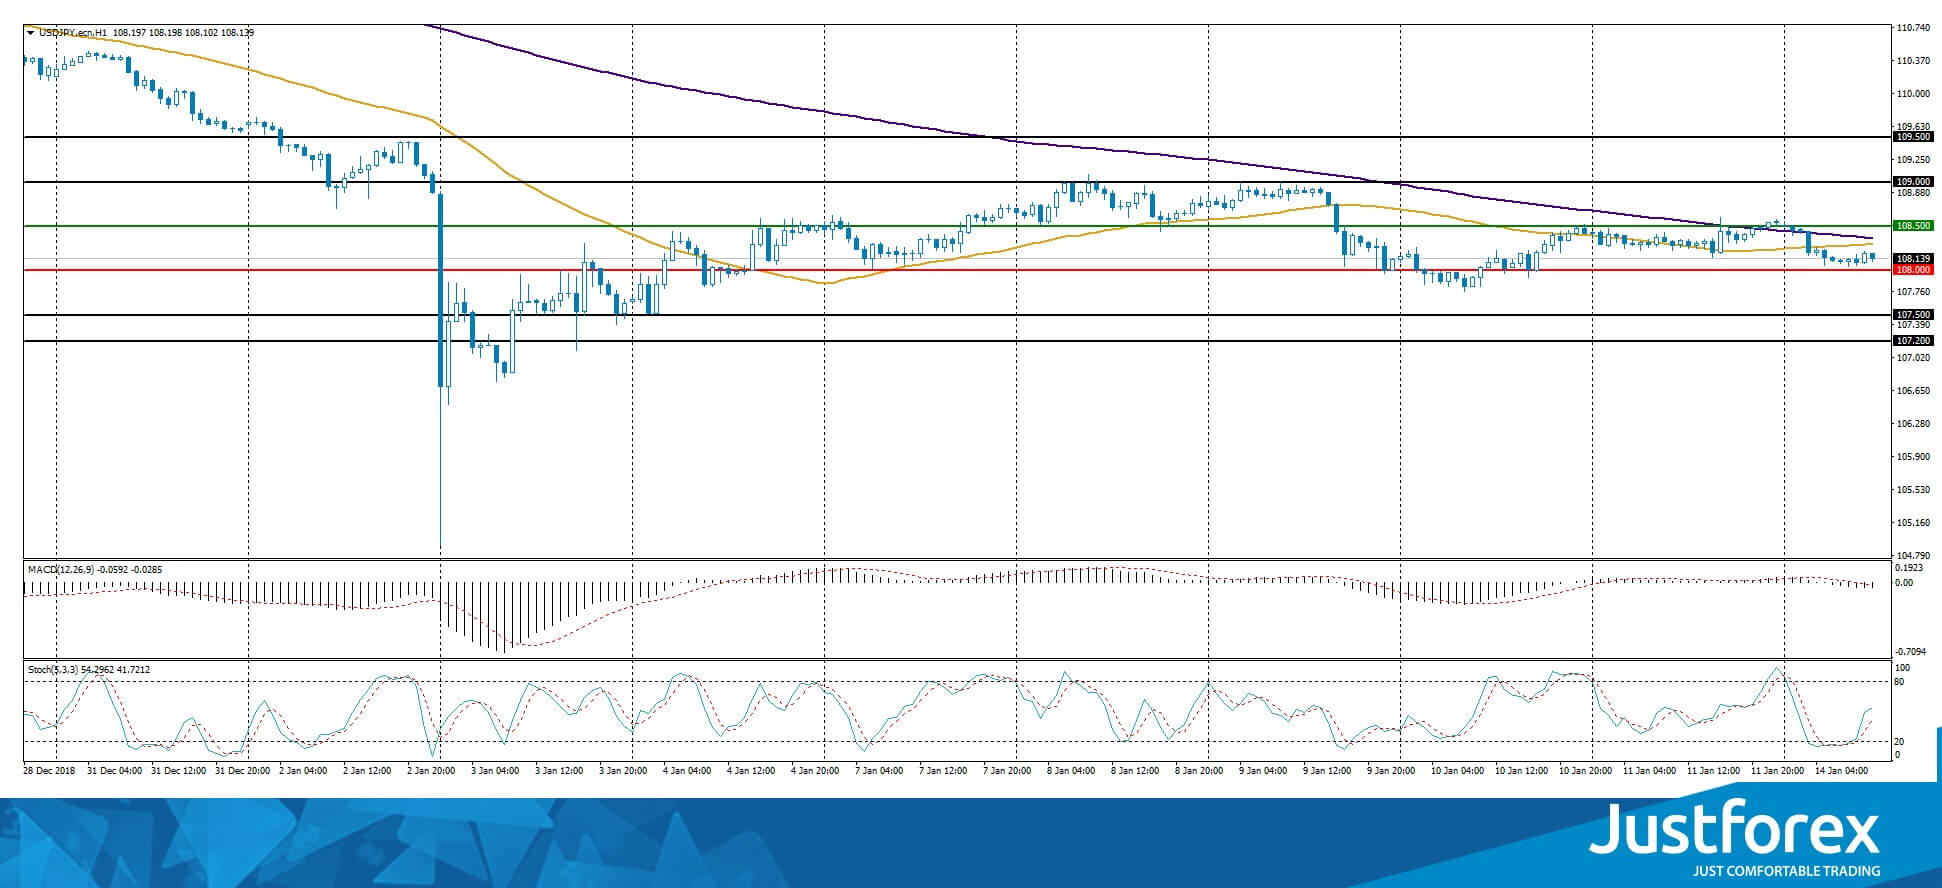
The price fixed below 50 MA and 200 MA which indicates a bearish mood.
The MACD histogram is close to 0, there are no signals.
The Stochastic Oscillator is in the neutral zone, the %K line is above the %D line which gives a signal to buy USD/JPY.
Trading recommendations
Support levels: 108.000, 107.500, 107.200
Resistance levels: 108.500, 109.000, 109.500
If the price fixes below the round 108.000 expect thequotes to descend toward 107.500-107.200.
Alternatively the quotes can grow toward 109.000-109.250.


