EUR/USD
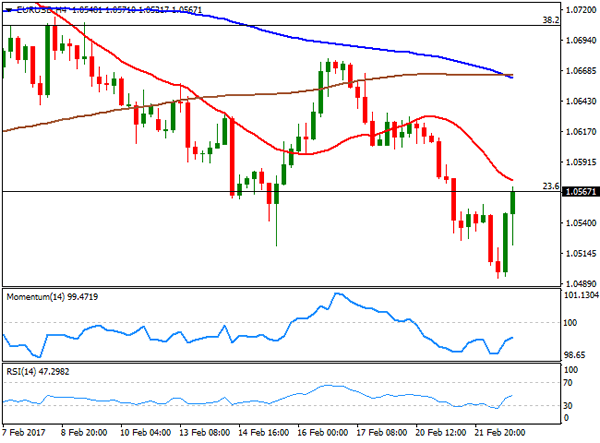
The EUR/USD pair plunged to 1.0493 following London’s opening, with the dollar gaining some traction as stocks jumped higher, and the common currency undermined by political woes. Data coming from Germany surprised to the upside, as the IFO survey showed that business sentiment improved in February, rising up to 111.00 from previous 109.8, with the assessment of the current situation up to 118.4 and expectations also on the rise, up to 104. Euro area annual inflation matched initial estimates, as the CPI was 1.8% in January 2017, up from 1.1% in December 2016, while it fell monthly basis by 0.8%, as expected.
In the US, existing home sales soared in January, up 3.3% to a seasonally adjusted annual rate of 5.69 million, but the EUR/USD pair turned higher, in the US afternoon, hitting 1.0565 after centrist Francois Bayrou confirmed he will not stand in France’s presidential election and has offered an alliance to independent candidate Emmanuel Macron, joining forces against far-right candidate Marine Le Pen. Despite the price reaction was limited, as investors were waiting for FOMC Minutes, it clearly indicated how sensitive the common currency is to political risk.
The EUR/USD pair spiked beyond the mentioned high, after the FED Minutes showed that many FED officials see a rate hike happening "fairly soon," if the economy remains on track, but also consider that there’s a modest risk of significant inflation. Also, policymakers didn’t advance their plans for the balance sheet, saying they will discuss the matter in later meetings.
Technically, the 4 hours chart shows that the price is struggling around the mentioned Fibonacci level, with the 20 SMA heading lower above the current level, and technical indicators recovering from oversold readings, but holding within negative territory, indicating limited buying interest at current levels. A recovery beyond 1.0590 could favor additional gains, but it would take an advance through 1.0635, to reduce chances of a new leg lower below 1.0500.
Support levels: 1.0520 1.0470 1.0440
Resistance levels: 1.0590 1.0635 1.0660
USD/JPY
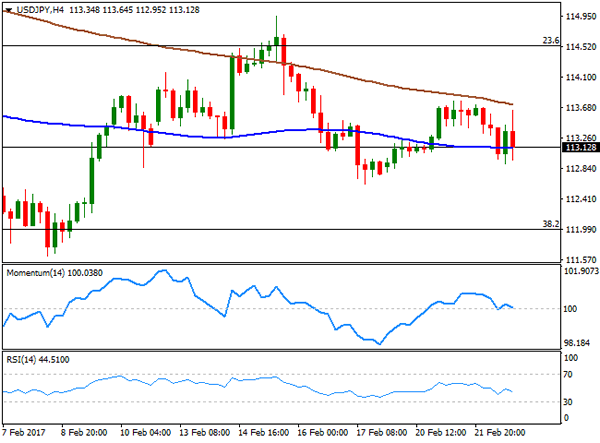
After spending most of the day under pressure, the USD/JPY pair bounced from a daily low of 112.90 mid American afternoon, as market’s sentiment improved following news that French candidate Francois Bayrou withdrew from the presidential race to join Emmanuel Macron against Marine Le Pen. US Treasury yields bounced with the 10-year benchmark up to 2.45% from previous 2.43%. The pair stabilized around 113.50 ahead of the FED’s Minutes, but fell after the release of the document, as the dollar was unable to rally following policymakers’ pledge to raise rates "fairly soon," should the economy remains in the growing path. The pair was once again weighed by yields, as the 10-year benchmark fell back to 2.42% following FED’s news. From a technical point of view, the risk remains towards the downside, as intraday advances remained contained by a bearish 200 SMA, currently around 113.70, whilst the price pressures its 100 SMA, and technical indicators turned lower around their mid-lines. Another attempt below 112.90, particularly if Asian shares fall, will probably open doors for additional declines towards the 112.00/20 region this Thursday.
Support levels: 112.90 112.50 112.10
Resistance levels: 113.70 114.20 114.60
GBP/USD
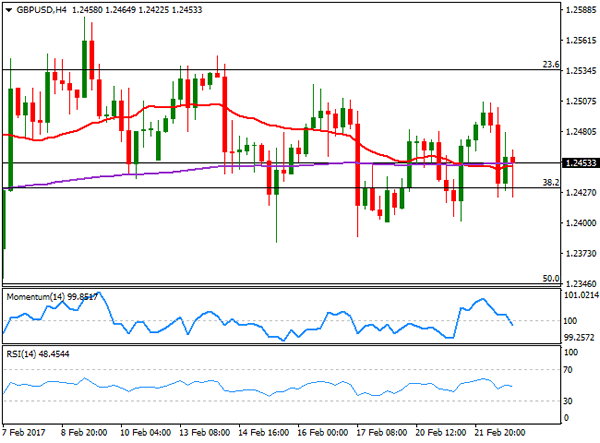
The GBP/USD pair continued struggling for direction this Wednesday, surging up to 1.2507 at the beginning of the day amid EUR/GBP falling to fresh yearly lows, and later falling to 1.2422, in spite of an upward revision to UK quarterly growth. The second estimate of Q4 GDP, was revised slightly higher to 0.7% from 0.6%, although the annualized figure came in at 2.0%, below the first estimate of 2.2%. Business investment fell by 1.0% in the same quarter, when compared to the previous one. The dollar gained some strength ahead of the release of the FOMC Minutes, backed by FED’s Powell comments, who said that the risk facing the US economy and more in balance, allowing the Central Bank to raise rates. The Minutes failed to boost the greenback, helping the GBP/USD to bounce back to mid-range. Technically, the pair has made no progress, still neutral as in the 4 hours chart, the price continues moving back and forth around a horizontal 20 SMA, whilst technical indicators are back around their mid-lines, with no clear directional strength.
Support levels: 1.2430 1.2380 1.2345
Resistance levels: 1.2480 1.2530 1.2565
GOLD
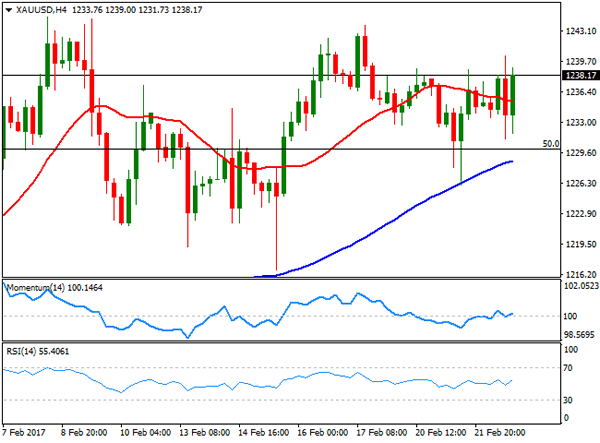
Gold prices advanced modestly at the beginning of the day, but trimmed gains and returned to opening levels ahead of the FOMC Minutes release, late in the US afternoon, and also paring gains as news coming from France took some pressure off the EU. Spot gold recovered back and settled at $1,237.80, as dollar’s bulls didn’t get enough from the minutes, which made no references to a certain date when it comes to rising rates. The technical picture for the commodity, however, hasn’t changed, as the price remains within its latest range. In the daily chart, the 20 DMA maintains a strong bullish slope, now converging with the 50% retracement of the post-US election decline around 1,230.00, the RSI indicator continues consolidating around 62, whilst the Momentum indicator extended its slide within positive territory, now pressuring its 100 level. In the 4 hours chart, technical readings present a neutral stance, as technical indicators hover around their mid-lines with no clear directional strength, whilst the price moves back and forth around a horizontal 20 SMA.
Support levels: 1,231.20 1,226.10 1,216.60
Resistance levels: 1,244.60 1,255.10 1,261.60
WTI CRUDE
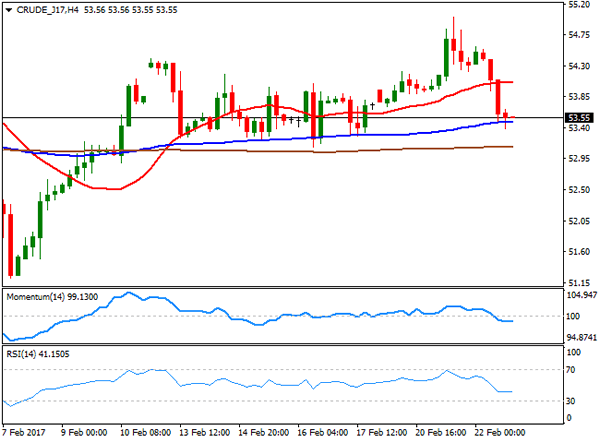
Crude oil prices retreated after flirting with multi-month highs on Tuesday, weighed by comments from Qatar’s oil minister Mohammed al-Sada, who said that major oil producers outside the OPEC weren’t cutting production as much as agreed last November, adding that compliance by non-OPEC members is about 50% of what has been promised. Adding to the bearish case news showed that US oil producers exported a record of 7 million barrels during the first week of February. West Texas Intermediate crude oil futures settled at $53.55 a barrel, the lower end of its weekly range. The daily chart shows that the price is now around a flat 20 SMA, whilst the Momentum indicator remains flat around its 100 level. The RSI indicator in the mentioned chart has returned to the 50 region, with a modest downward slope. In the 4 hours chart, the price has accelerated lower after breaking below an anyway flat 20 SMA, whilst technical indicators settled within negative territory with no clear directional strength.
Support levels: 53.40 53.00 52.50
Resistance levels: 54.10 54.75 55.30
DJIA
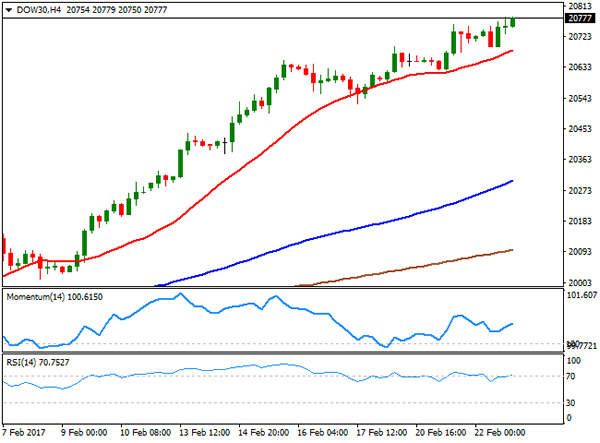
US stocks closed the day mixed, with the Dow Jones Industrial Average extending its rally to record highs, after an intraday decline following FOMC Minutes, up by 32 points to settle at 20,775.60. The Nasdaq Composite and the S&P closed in the red, with the first down 0.09%, to 5,860.63 and the second ending at 2,362.82 after losing 2 points. US equities pared early gains after the Minutes from the latest FED meeting showed that policymakers, despite supporting a soon rate hike, are still concerned about Trump’s fiscal policy. The daily chart for the DJIA shows that the benchmark holds at its daily highs after the close, not far from the mentioned close, whilst technical indicators maintain their upward momentum, despite being in extreme overbought territory. The index has posted its largest bullish streak in three decades, and despite technical readings continue supporting an upward extension, the possibility of a downward corrective movement can’t be dismissed at this point. In the shorter term, and according to the 4 hours chart, the 20 SMA continues leading the way higher, with buying interest surging on approaches to it, and technical indicators holding well into positive territory, albeit losing their upward strength.
Support levels: 20,730 20,692 20,638
Resistance levels: 20,780 20,825 20,860
FTSE 100
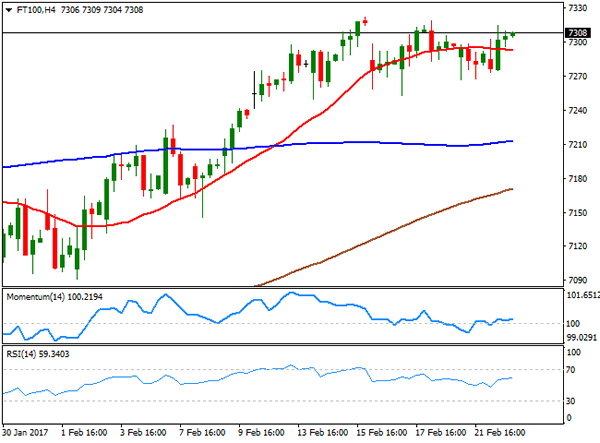
The FTSE 100 managed to advance 27 points or 0.38%, ending the day at 7,302.25, helped by a recovery in Unilever, as the company announced it will review ways to increase value for shareholders, with the share ending the day up 6.85%, right behind Capita, which added 8.66%. Lloyds Bank was also among the best performers, adding 4.39% after reporting an increase in its statutory profits from £1.6 billion in 2015, to £4.2 billion, and confirmed a £2.2 billion dividend payout to shareholders. Mining shares were among the worst performers, with Anglo American ending the day3.75% lower and BHP Billiton shedding 2.70%. The index has advanced within range, still holding above its 20 DMA in the daily chart, and with technical indicators consolidating within positive territory, with no clear directional strength. In the shorter term, and according to the 4 hours chart, the index maintains a neutral stance, hovering around a horizontal 20 SMA and with technical indicators heading nowhere around their mid-lines.
Support levels: 7,296 7,253 7,212
Resistance levels: 7,319 7,354 7,390
DAX
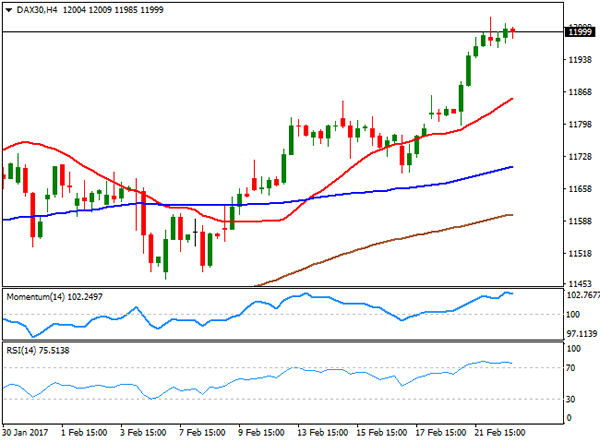
European equities opened with a strong footing, but the upward momentum faded as the session went back, and the German DAX closed the day modestly higher at 11,998.59, up by 31 points, anyway the highest close since March 2015. ThyssenKrupp was the best performer by adding 4.29%, followed by Fresenius Medical Care that closed 2.02% higher. Volkswagen on the other hand was the worst performer, down 1.72%, followed by Bayer that shed 1.20%. The index briefly advanced above 12,000, overall maintaining the positive tone, as in the daily chart, it settled above a bullish 20 DMA, whilst technical indicators have lost upward strength, but hold well above their mid-lines. In the 4 hours chart, the index is far above a now sharply bullish 20 SMA, whilst technical indicators have barely retreated within overbought territory, with no signs of changing bias any time soon.
Support levels: 11,965 11,920 11,873
Resistance levels: 12,031 12,079 12,128