
The EUR/USD currency pair
Technical indicators of the currency pair:
Prev Open: 1.13803
Open: 1.13010
% chg. over the last day: -0.59
Day’s range: 1.13205 – 1.13345
52 wk range: 1.1214 – 1.2557
Yesterday EUR/USD saw aggressive sell-offs. EUR is weakened against the USD due to the statements by the Mario Draghi that the EU economic reports are below the forecasted. However, the key interest rate remained without any changes, just as expected. You should open positions from the key levels of 1.13100 and 1.13400. The trading instrument begins to recover.
The Economic News Feed for 25.01.2019:
IFO Business Climate Index (GER) – 11:00 (GMT+2:00);
Basis Orders on Durable Goods (US) – 15:30 (GMT+2:00);
Primary Real Estate Sales (US) – 17:00 (GMT+2:00);
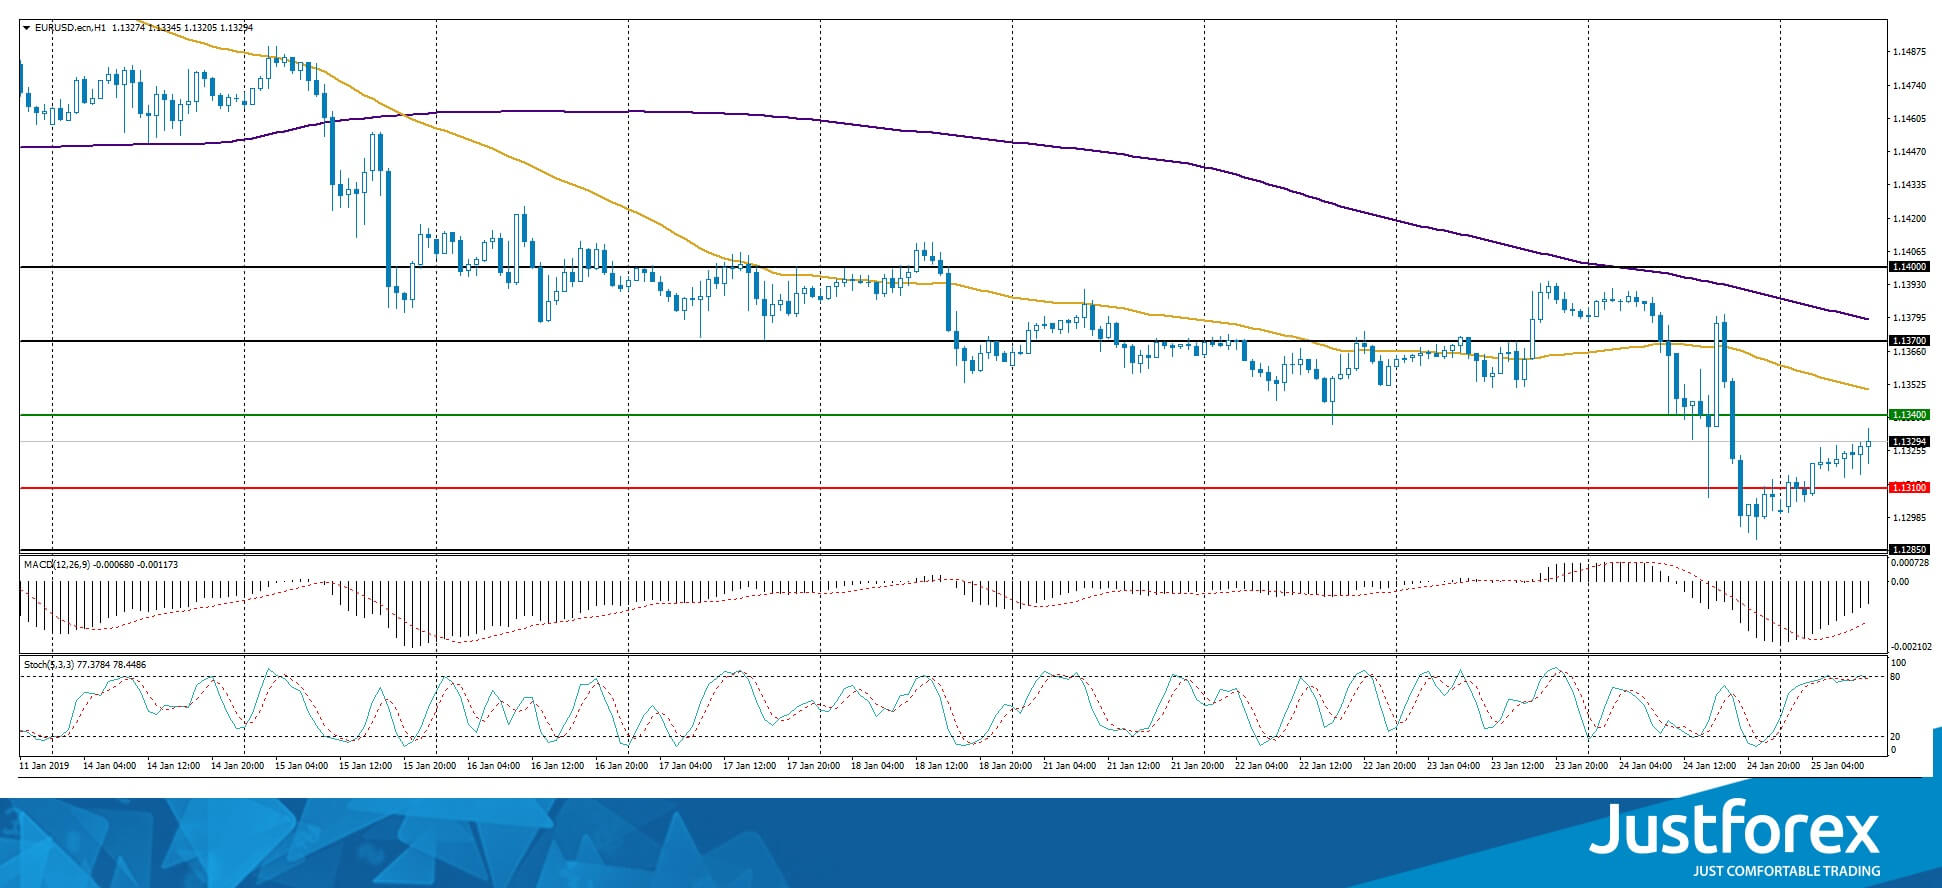
The indicators point to the power of the sellers, the price fixed below 50 MA and 200 MA.
The MACD histogram is in the negative zone but above the signal line, which gives a weak signal to sell EUR/USD.
The Stochastic Oscillator is near the overbought zone, the %K line is crossing the %D line. There are no signals.
Trading recommendations
Support levels: 1.13100, 1.12850
Resistance levels: 1.13400, 1.13700, 1.14000
If the price fixes below 1.130100 expect the EUR/USD quotes to fall toward 1.12850-1.12500.
Alternatively, the currency pair can grow toward 1.13700-1.14000.
The GBP/USD currency pair
Technical indicators of the currency pair:
Prev Open: 1.30680
Open: 1.30624
% chg. over the last day: +0.39
Day’s range: 1.30700 – 1.30890
52 wk range: 1.2438 – 1.4378
Yesterday, GBP/USD was in a variety of trends. The GBP was supported by the news that the Democratic Union Party of Northern Ireland decided to approve of the Theresa May`s Brexit plan next week. You should open positions from the key levels of 1.30600 and 1.31200. The trading instrument has prospects to descend further.
The Economic News Feed for 25.01.2019 is calm.
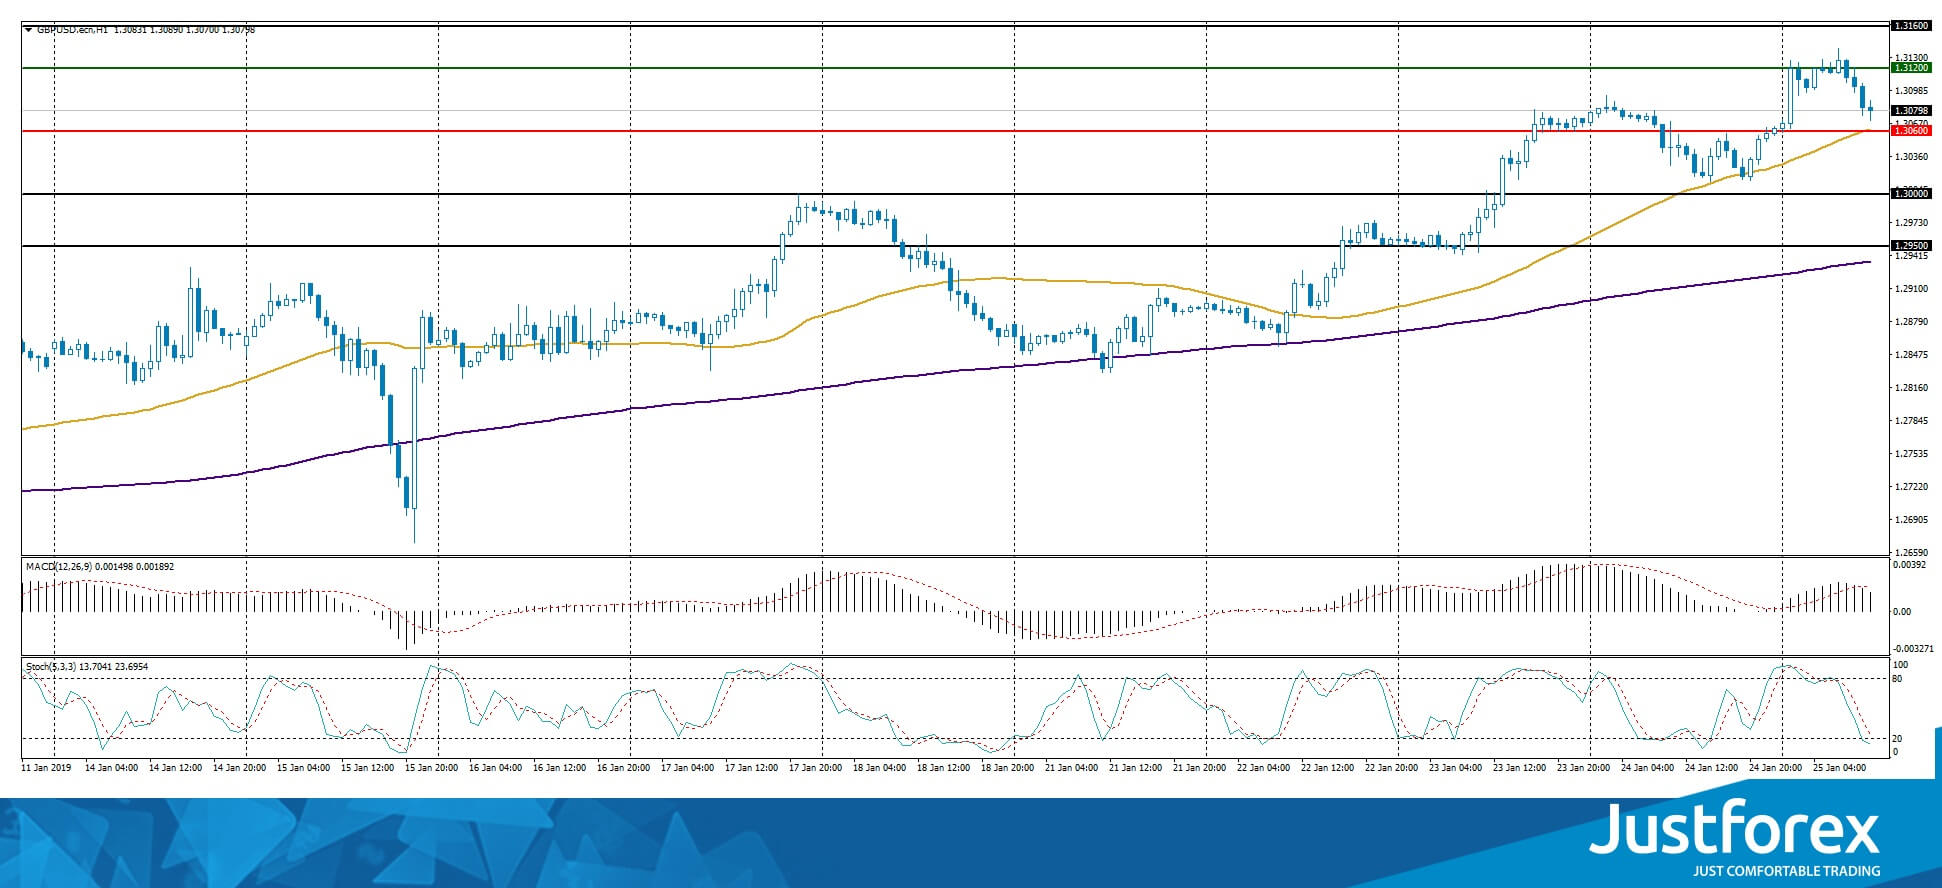
The indicators point to the power of the byers, the price fixed above 50 MA and 200 MA.
The MACD histogram is in the positive zone but below the signal line, which gives a weak signal to buy GBP/USD.
The Stochastic Oscillator is near the oversold zone, the %K line is below the %D line which points to a bearish mood.
Trading recommendations
Support levels: 1.30600, 1.30000, 1.29500
Resistance levels: 1.31200, 1.31600
If the price fixes below 1.30600, the quotes are going to fall towards the round 1.30000.
Alternatively, the quotes can rise toward 1.31600-1.31800.
The USD/CAD currency pair
Technical indicators of the currency pair:
Prev Open: 1.33400
Open: 1.33455
% chg. over the last day: +0.08
Day’s range: 1.33121 – 1.33278
52 wk range: 1.2248 – 1.3664
Yesterday USD/CAD remained in a variety of trends. Right now the technical picture is still ambiguous as the investors await the additional drivers. The key levels are 1.33100 and 1.33400. You should open positions from these levels and keep an eye on the oil quotes dynamics.
The Economic News Feed for 25.01.2019 is calm.
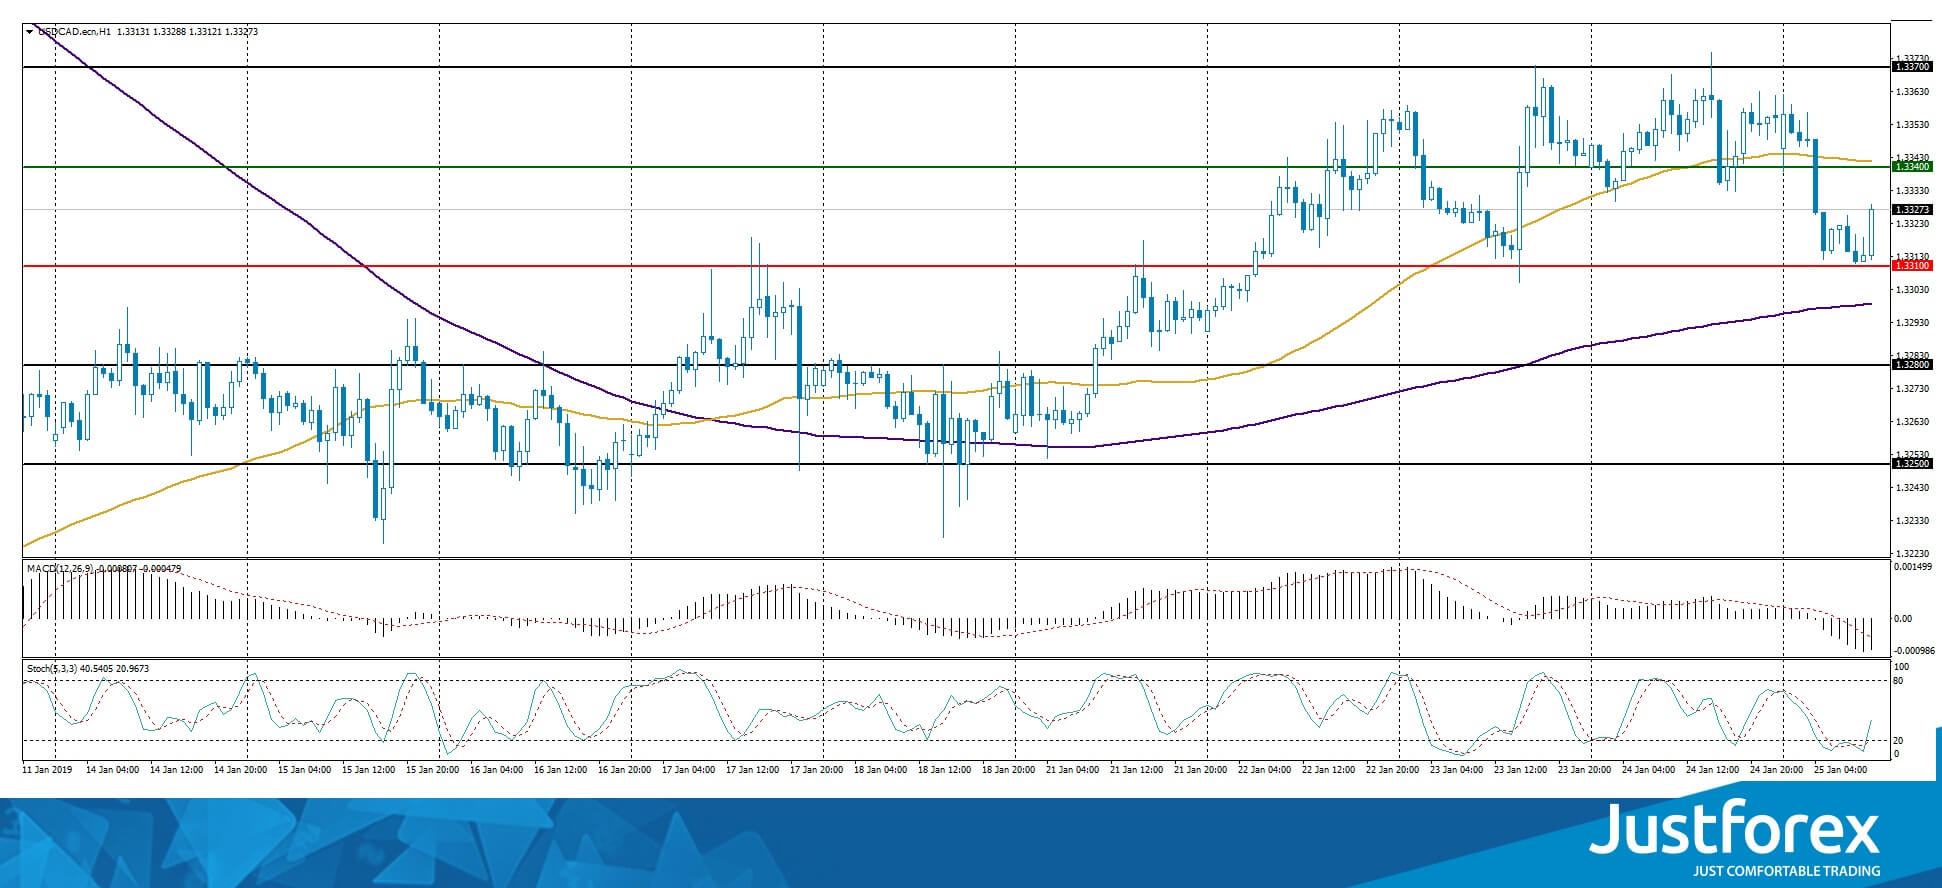
The price fixed between 50 MA and 200 MA which act as the dynamic support and resistance levels.
The MACD histogram is in the negative zone and below the signal line which gives a strong signal to sell USD/CAD.
The Stochastic Oscillator is in the oversold zone, the %K line is crossing the %D line. There are no signals.
Trading recommendations
Support levels: 1.33100, 1.32800, 1.32500
Resistance levels: 1.33400, 1.33700
If the price fixes above the mirror support of 1.33400, consider buying USD/CAD. The price will move toward 1.33700-1.34000.
Alternatively the quotes can fall toward 1.32800-1.32500.
The USD/JPY currency pair
Technical indicators of the currency pair:
Prev Open: 109.564
Open: 109.625
% chg. over the last day: +0.00
Day’s range: 109.811 – 109.822
52 wk range: 104.56 – 114.56
USD/JPY is currently in a variety of trends. The investors are waiting for additional divers. The key levels are 109.700 and 110.000. You should open positions from these levels. Keep an eye on the US Treasury 10-year yield.
The Economic News Feed for 25.01.2019 is calm.
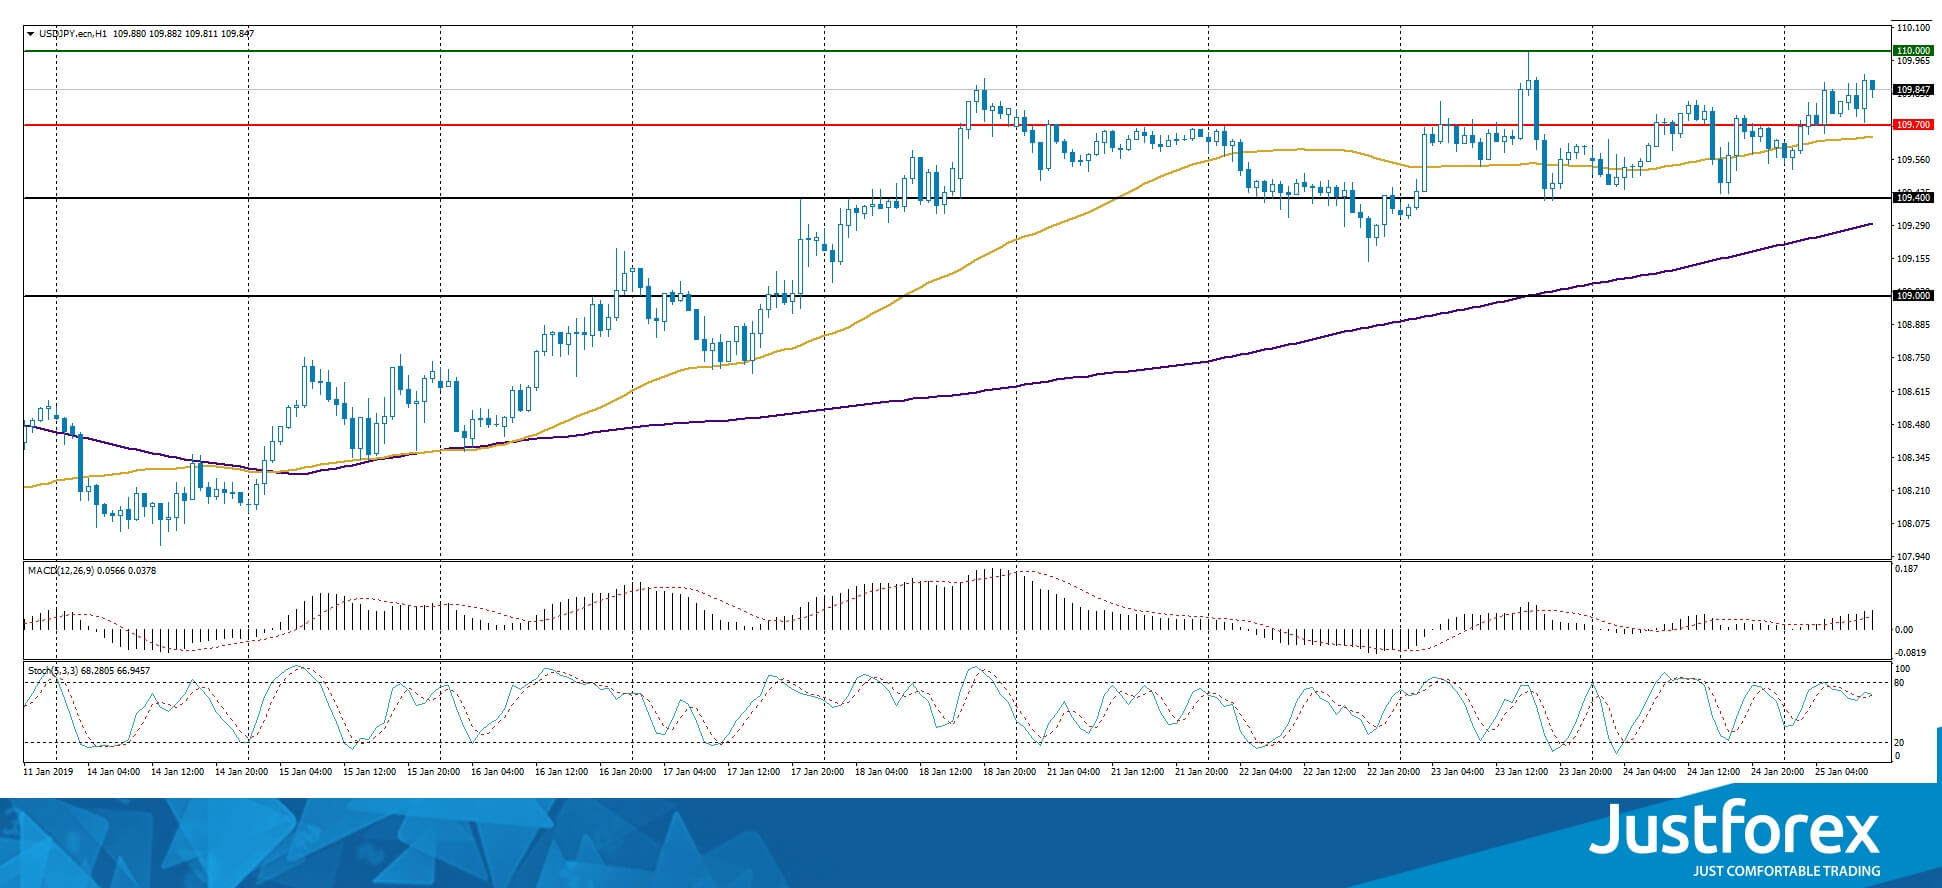
The price fixed above 50 MA and 200 MA which points to the power of the buyers.
The MACD histogram is in the positive zone and above the signal line which gives a strong signal to buy USD/JPY.
The Stochastic Oscillator is in the neutral zone, the %K line is crossing the %D line. There are no signals.
Trading recommendations
Support levels: 109.700, 109.400, 109.000
Resistance levels: 110.000, 110.250
If the price fixes above the round 110.000 consider buying USD/JPY. The movement will tend toward 110.250-110.500.
Alternatively the quotes can fall toward 109.400-109.000.


