
The EUR/USD currency pair
Technical indicators of the currency pair:
Prev Open: 1.14461
Open: 1.14511
% chg. over the last day: +0.12
Day’s range: 1.14380 – 1.14598
52 wk range: 1.1214 – 1.2557
On Friday the financial markets participants evaluated the labour reports from the US. In January the number of employees in the non-agricultural sector of the country reached 304 000 which was way above the predicted 165 000. At the same time, the other key indicators had a negative effect: the growth of the hourly wage slowed down from 0.4% (m/m) to 0.1% (m/m), while the unemployment level grew to 4%. The industrial PMI by ISM grew by 4.2% in January, up to 56.6. The attention will be focused on the statements by Donald Trump and the Federal Reserve representatives. Right now the currency pair is consolidating around 1.14350-1.14600. You should open positions from these levels.
At 17:00 (GMT+2:00) the US will publish the report on the industrial orders’ volume.
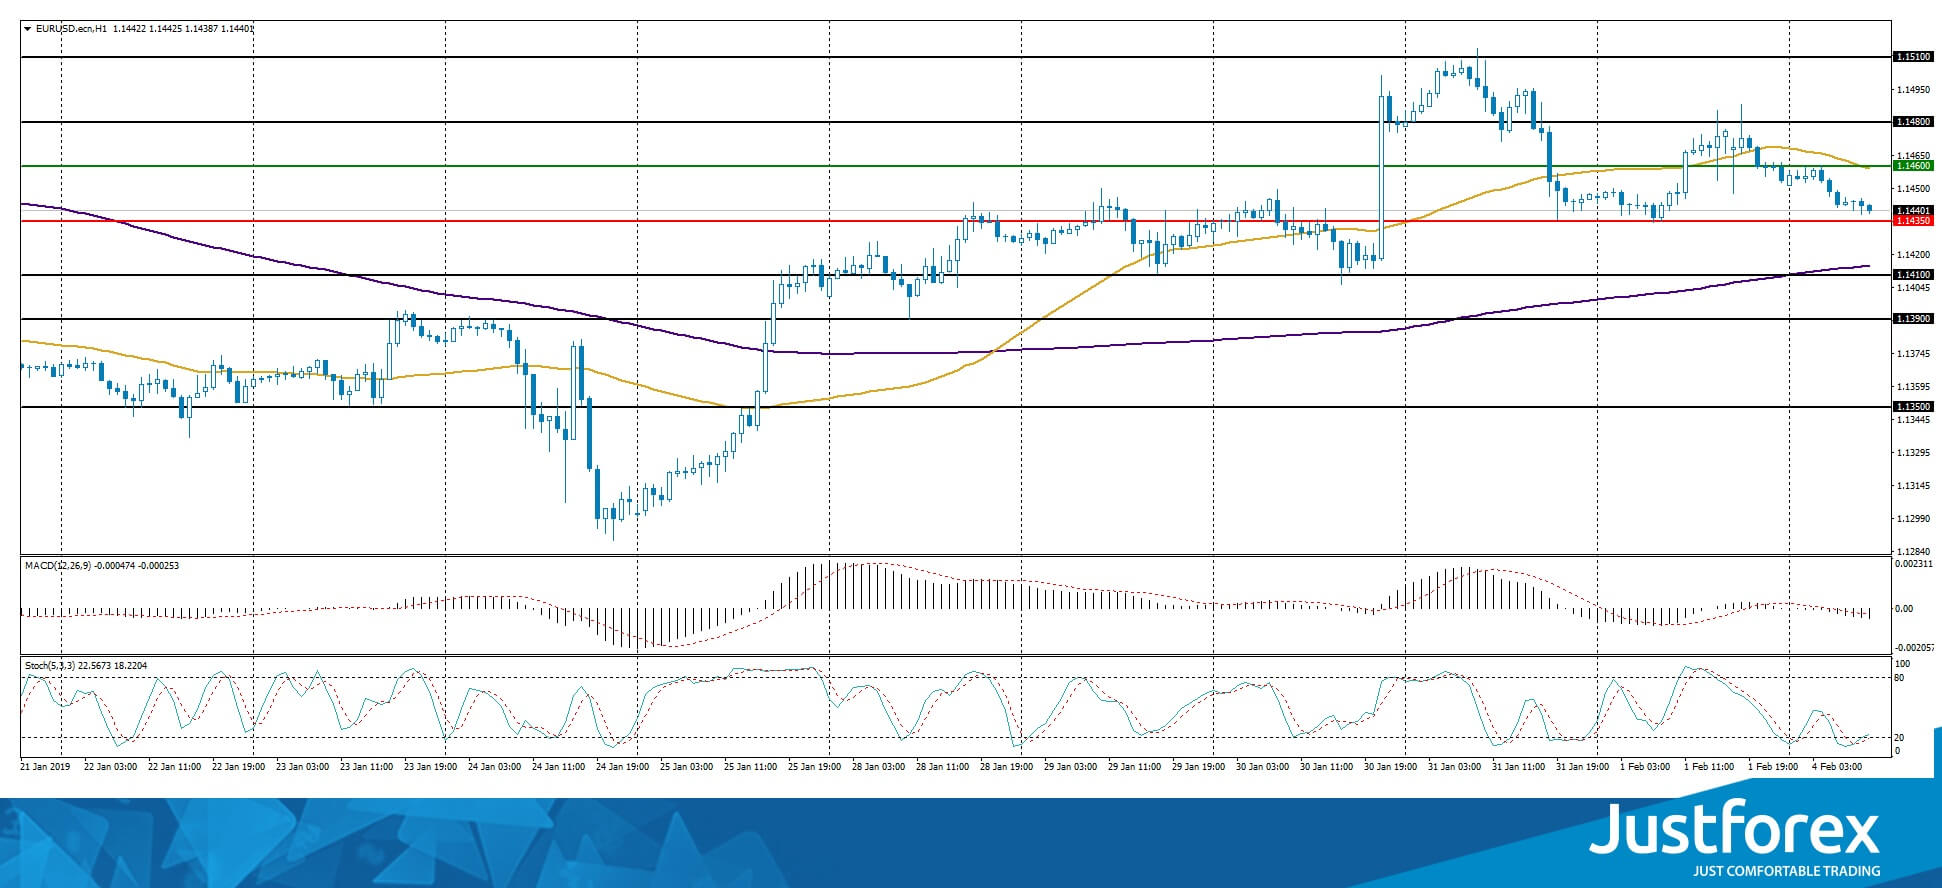
The indicators don’t provide precise signals, the price fixed between 50 MA and 200 MA.
The MACD histogram is in the negative zone and below the signal line, which gives a strong signal to sell EUR/USD..
The Stochastic Oscillator is around the oversold zone, the %K line is crossing the %D line. There are no signals at the moment.
Trading recommendations
Support levels: 1.14350, 1.14100, 1.13900
Resistance levels: 1.14600, 1.14800, 1.15100
If the price fixes below the 1.14350 mark, expect the quotes to descend toward 1.14000-1.13800.
Alternatively, the quotes can recover toward the round 1.15000.
The GBP/USD currency pair
Technical indicators of the currency pair:
Prev Open: 1.31010
Open: 1.30612
% chg. over the last day: -0.12
Day’s range: 1.30552 – 1.30960
52 wk range: 1.2438 – 1.4378
GBP/USD remains ambiguous, keeps trading in a flat. The financial market participants are waiting for new information on Brexit. Keep an eye on the UK economic reports and open positions from the key levels of 1.30500 and 1.31000.
The Economic News Feed for 04.02.2019:
Construction PMI (UK) – 11:30 (GMT+2:00);
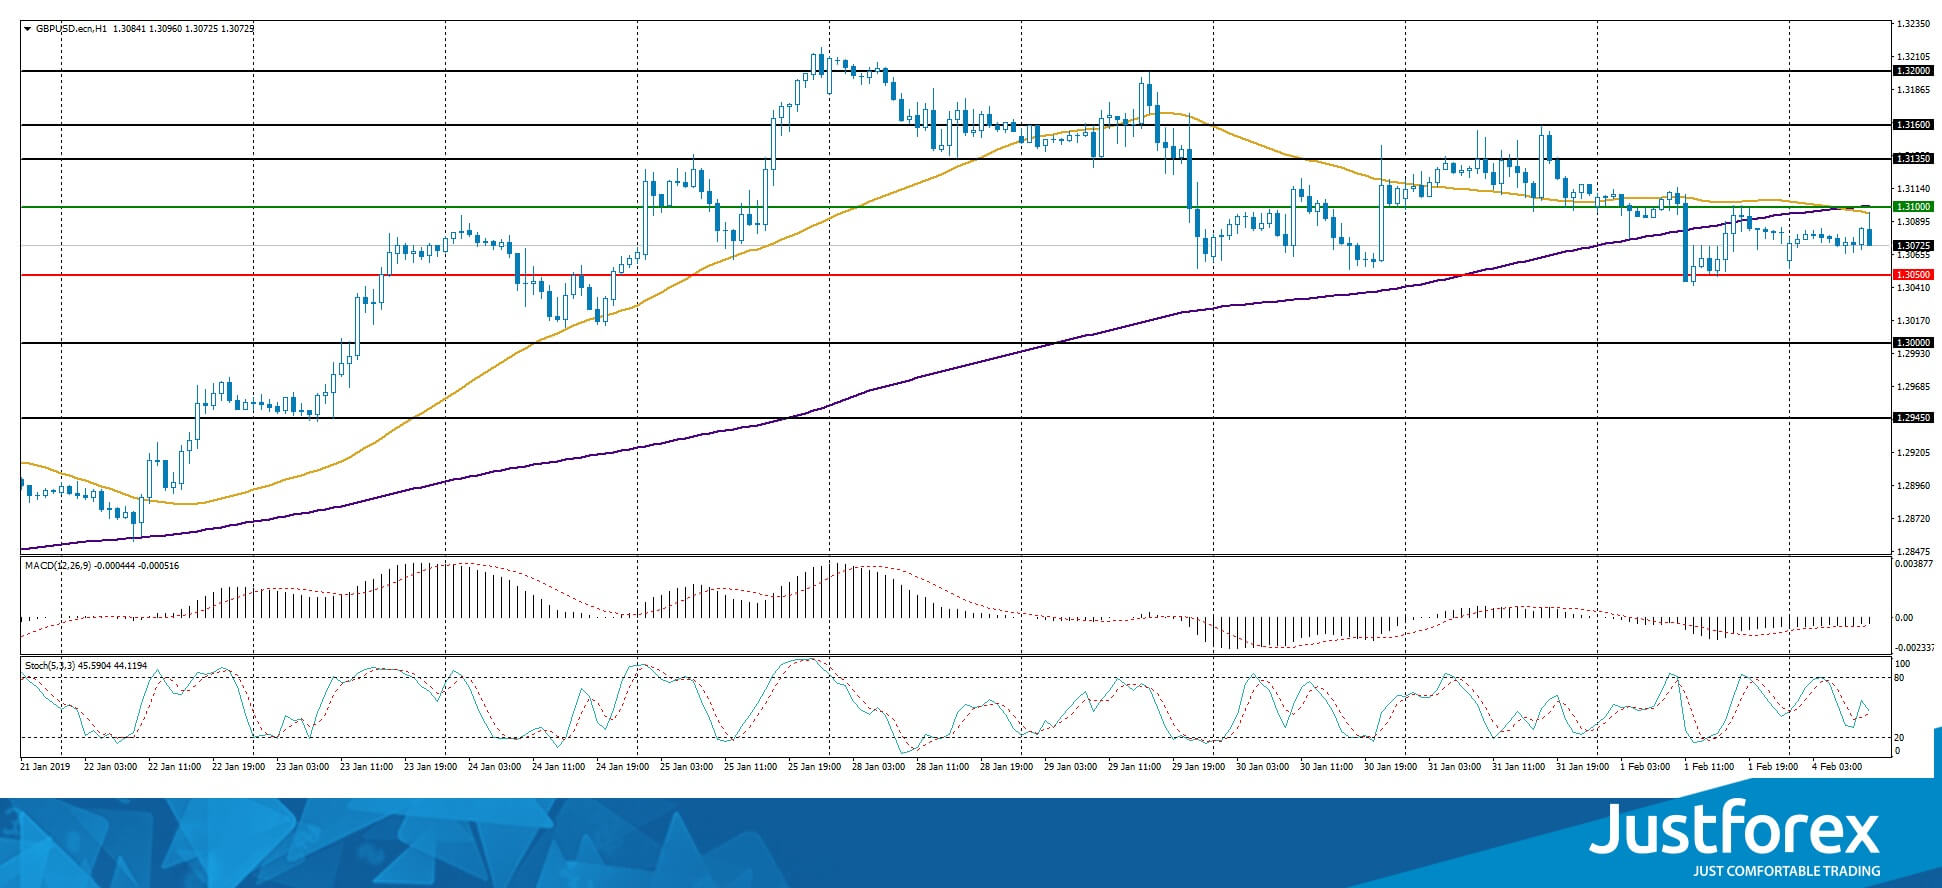
The indicators do not provide precise signals, 50 MA is crossing 200 MA.
The MACD histogram is in the negative zone but above the signal line, which gives a weak signal to sell GBP/USD.
The Stochastic Oscillator is in the neutral zone, the %K line is crossing the %D line. There are no signals at the moment.
Trading recommendations
Support levels: 1.30500, 1.30000, 1.29450
Resistance levels: 1.31000, 1.31350, 1.31600
If the price fixes below the key support of 1.30500 expect the quotes to correct toward 1.30000.
Alternatively, the quotes can recover toward 1.31350-1.31600.
The USD/CAD currency pair
Technical indicators of the currency pair:
Prev Open: 1.31213
Open: 1.30891
% chg. over the last day: -0.18
Day’s range: 1.30836 – 1.31065
52 wk range: 1.2248 – 1.3664
USD/CAD remains in a bearish mood, the quotes are consolidating around the 3-month minimums of 1.30700-1.31200. A technical correction is possible soon. Keep an eye on the oil quotes and open positons from the key levels.
The Economic News Feed for 04.02.2019 is calm.
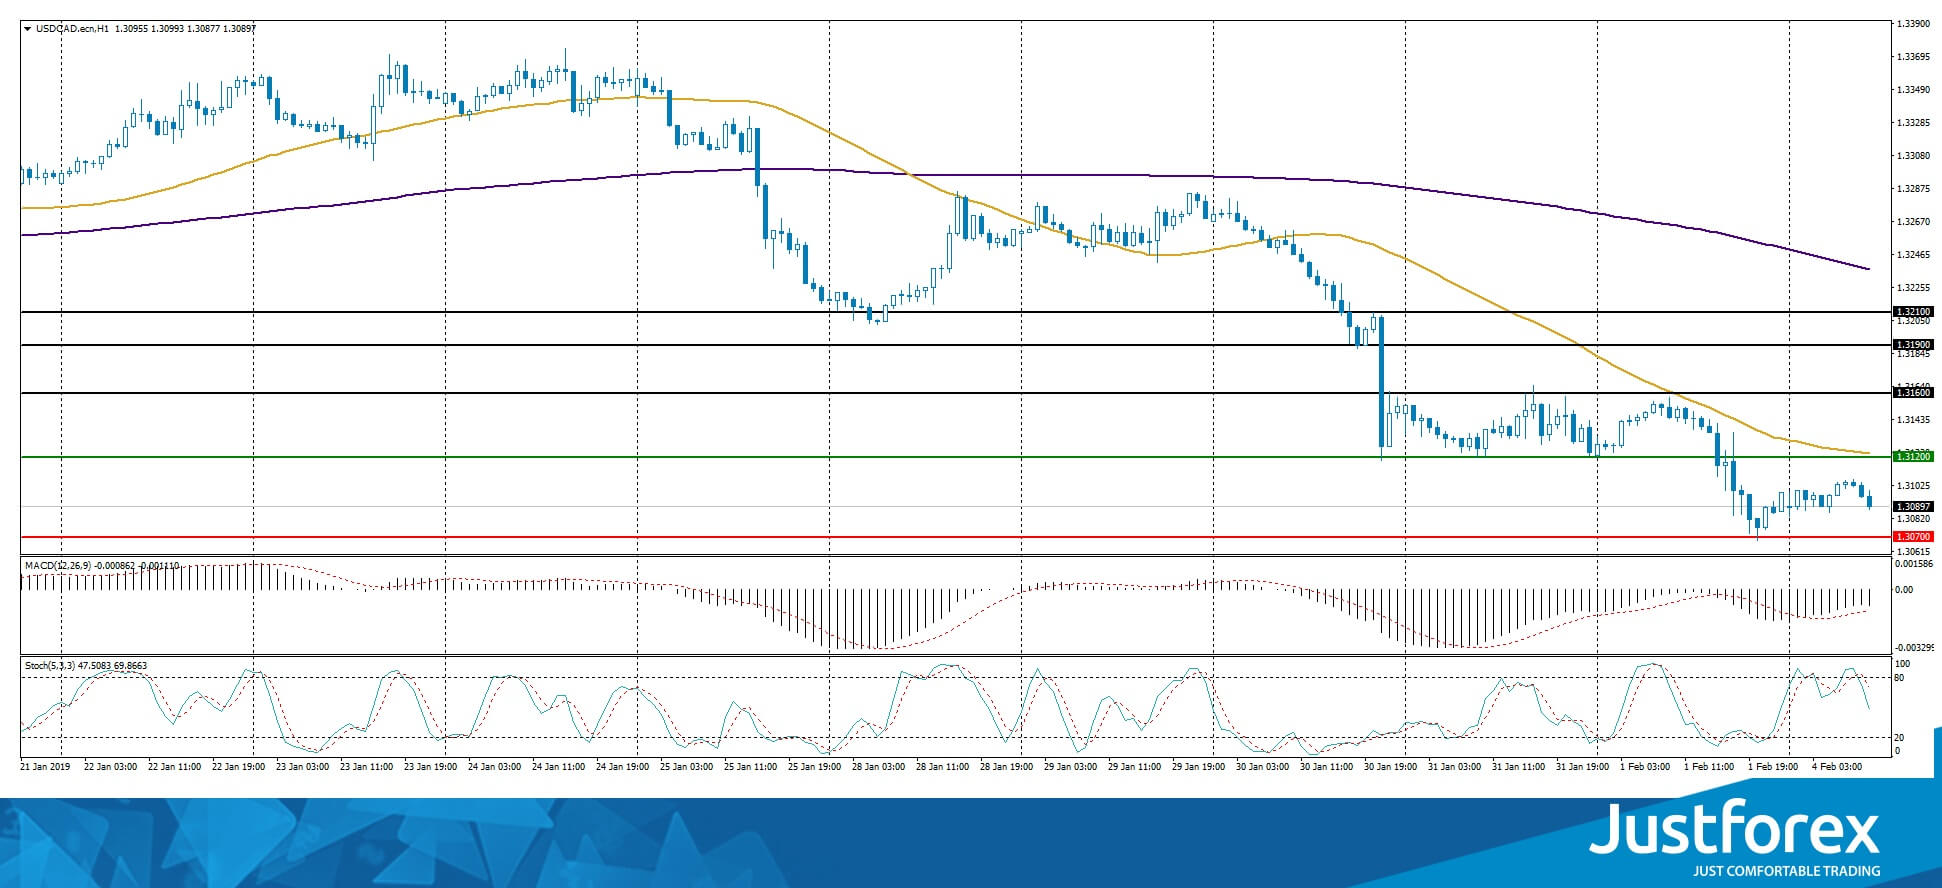
The price fixed below 50 MA and 200 MA which points to the power of the sellers.
The MACD histogram is in the negative zone but above the signal line which gives a weak signal to sell USD/CAD.
The Stochastic Oscillator is in the neutral zone, the %K line is below the %D line which also points toward a downward trend.
Trading recommendations
Support levels: 1.30700, 1.30200, 1.30000
Resistance levels: 1.31200, 1.31600, 1.31900
If the price fixes below 1.30700 expect the USD/CAD quotes to fall toward 1.30300-1.30000.
Alternatively the quotes can grow toward 1.31400-1.31600.
The USD/JPY currency pair
Technical indicators of the currency pair:
Prev Open: 108.859
Open: 109.513
% chg. over the last day: +0.57
Day’s range: 109.432 – 109.909
52 wk range: 104.56 – 114.56
USD/JPY is in an aggressive buy-out, the quotes have updated the local maximums and are testing the resistance at 109.900. 109.650 acts as a mirror support. The quotes have prospects for future growth. Keep an eye on the US Treasury bonds` yield and open positions from the key levels.
The Economic News Feed for 04.02.2019 is calm.
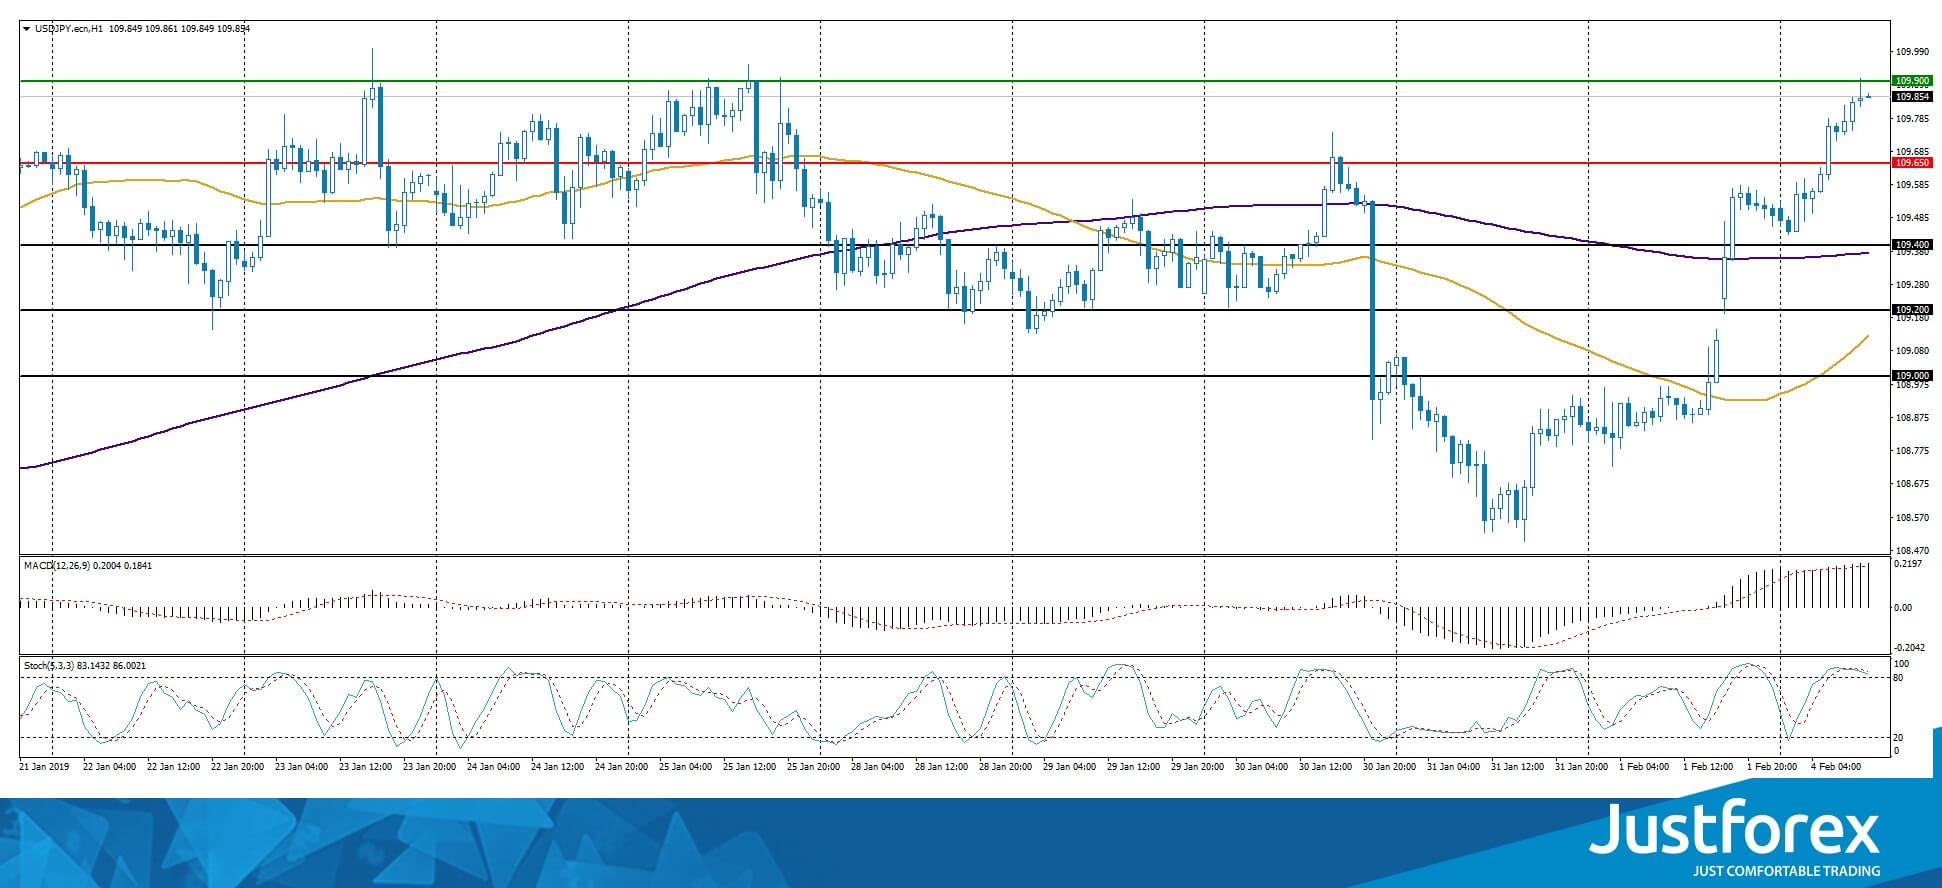
The price fixed below 50 MA and 200 MA which points to the power of the buyers.
The MACD histogram is in the positive zone and above the signal line which points to a bullish mood.
The Stochastic Oscillator is in the overbought zone, the %K line is crossing the %D line. There are no signals at the moment.
Trading recommendations
Support levels: 109.650, 109.400, 109.200
Resistance levels: 109.900, 110.400
If the price fixes above the resistance level of 109.900 expect the USD/JPY quotes to grow toward 110.300-110.500.
Alternatively, the quotes can descend toward 109.500-109.400.


