
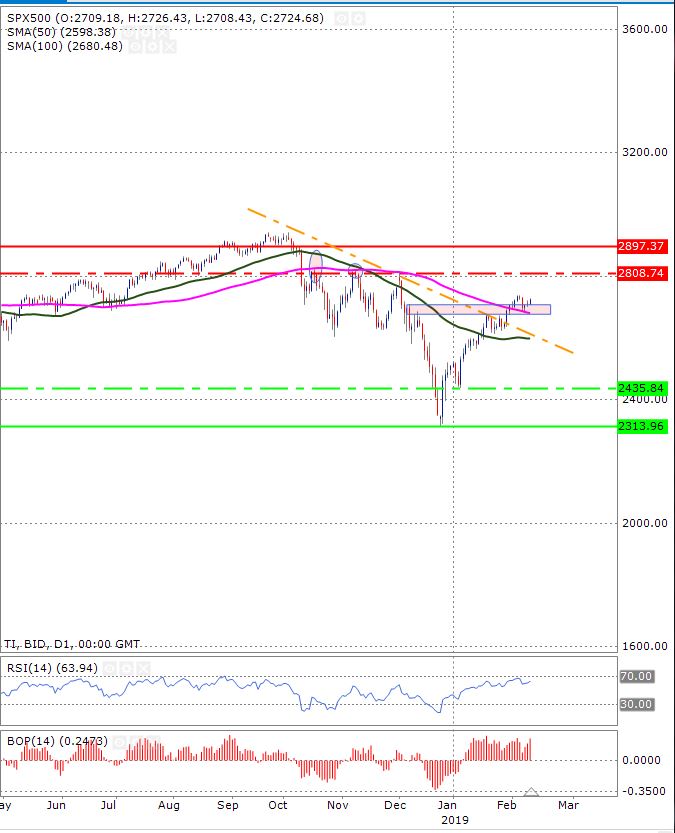
The S&P500 index has broken its downward trend line on a daily time frame. This confirms the fact that the downtrend is no longer in play. The fact that the price is also trading above the 100-day and 50-day moving averages (shown in pink and green respectively) further confirms the above argument. The 100-day moving average has recently acted as a support, shown by the red arrow, and as long as the price stays above this, the upward momentum is likely to remain strong. A break of 100-day moving average may push the price to the 50-day moving average.
The RSI is trading near the oversold region and this suggests that the price may actually break below the 100-day moving average. The balance of power shows that the bulls are still in full control of the price.
The minor support zone is shown by the dotted green horizontal line and the major support zone is shown by the solid line.
The minor resistance zone is shown by the dotted red horizontal line and the major resistance zone is shown by the solid resistance line.


