
Key Highlights
- The US Dollar traded higher recently and broke the 110.80 resistance against the Japanese Yen.
- There is a strong support and bullish trend line formed near 110.20 on the 4-hours chart of USD/JPY.
- The US Initial Jobless Claims for the week ending Feb 17, 2019 declined from 239K to 216K.
- The Euro Zone CPI for Jan 2019 will be released today, which could increase 0.2% (MoM).
USDJPY Technical Analysis
After trading as high as 111.12, the US Dollar corrected lower against the Japanese Yen. The USD/JPY pair corrected below 110.50, but the 110.25 level acted as a strong support and the pair bounced back.
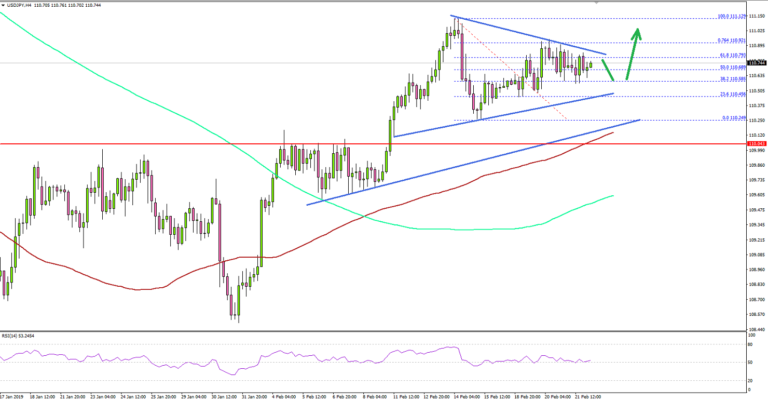
Looking at the 4-hours chart, the pair recovered above the 110.50 resistance remained well positioned above the 100 (red) simple moving average (4-hours). There was a break above the 50% Fib retracement level of the last decline from the 111.12 high to 110.24 low.
However, the upside move faced sellers near the 111.00 level and the 76.4% Fib retracement level of the last decline from the 111.12 high to 110.24 low.
Later, the pair started consolidating gains above a strong support and bullish trend line near 110.20 on the same chart. On the upside, the pair must gain momentum above the 111.00 and 111.20 resistance levels to stage further gains. The next resistance levels are 111.50 and 111.80.
On the downside, the mains supports are 110.25 and 110.20, below which the pair could test the 100 (red) simple moving average (4-hours). If there is a daily close below 110.00, the pair could move back in the bearish zone, with next targets as 109.60 and 109.20.
Fundamentally, the US Initial Jobless Claims figure for the week ending Feb 17, 2019 was released recently. The market was looking for a decline from 239K to 229K.
However, the result was better than the forecast as the Initial Jobless Claims declined from 239K to 216K. The report added that:
The 4-week moving average was 235,750, an increase of 4,000 from the previous week’s unrevised average of 231,750. This is the highest level for this average since January 20, 2018 when it was 237,500.
Overall, there was short-term weakness in the US Dollar and pairs like EUR/USD and GBP/USD recovered recently. However, USD/JPY remains well supported for more gains as long as it is above 110.20.
Economic Releases to Watch Today
- German Gross Domestic Product for Q4 2018 (YoY) – Forecast 0.9%, versus 0.9% previous.
- German Gross Domestic Product for Q4 2018 (QoQ) – Forecast 0%, versus 0% previous.
- Euro Zone CPI for Jan 2019 (YoY) – Forecast +1.4, versus +1.4% previous.
- Euro Zone CPI for Jan 2019 (MoM) – Forecast +0.2%, versus 0% previous.


