
The EUR/USD currency pair
Technical indicators of the currency pair:
Prev Open: 1.13703
Open: 1.13802
% chg. over the last day: +0.05
Day’s range: 1.13490 – 1.13812
52 wk range: 1.1214 – 1.2557
EUR/USD is showing an ambiguous technical picture. The trading instrument is moving in a flat. The local support and resistance levels are 1.13500 and 1.13750. The demand for the USD remains high. Additional support is given by the positive US Treasury bonds dynamic. The negotiations between the Washington and Beijing are in the spotlight. According to WSJ, US and China made progress in the negotiations and can reach an aggreement by March 27. The EUR/USD quotes have a tendency to descend. You should open positions from the key levels.
The Economic News Feed for 04.03.2019 is calm.
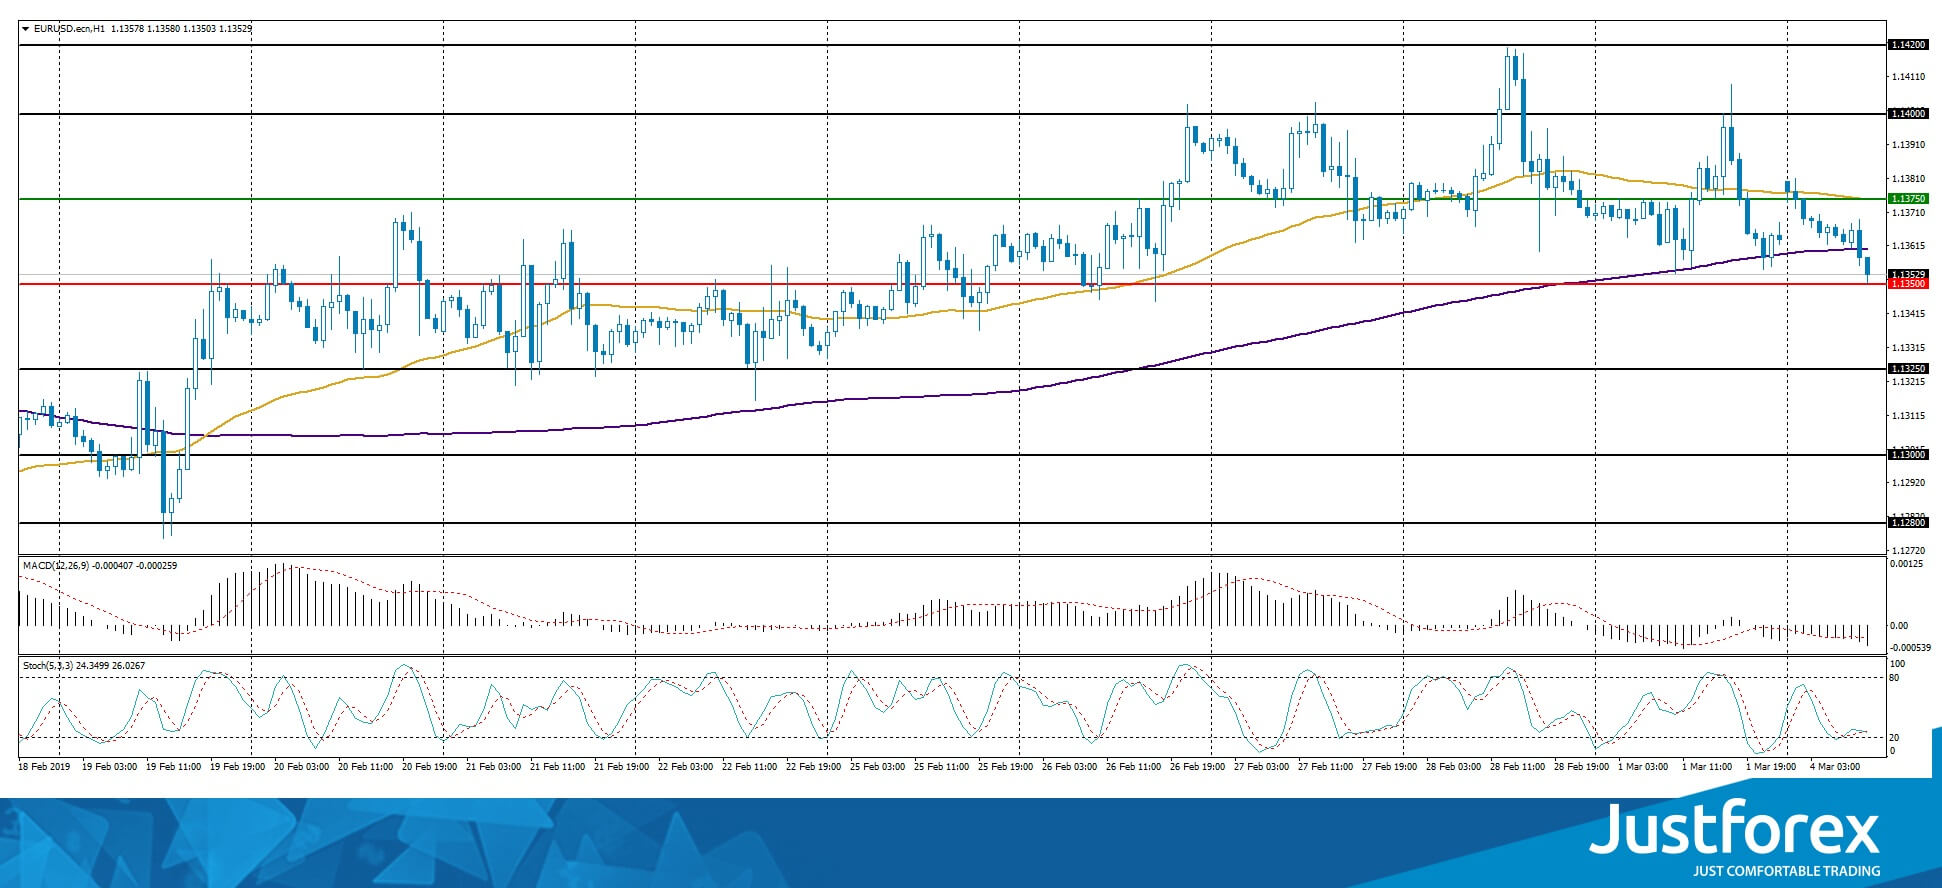
The indicators do not provide precise signals, the price has crossed 200 MA.
The MACD histogram is in the negative zone and below the signal line, which gives a strong signal to sell EUR/USD.
The Stochastic Oscillator is near the oversold zone, the %K line is crossing the %D line. There are no signals at the moment.
Trading recommendations
Support levels: 1.13500, 1.13250, 1.13000
Resistance levels: 1.13750, 1.14000, 1.14200
If the price falls below 1.13500, expect the quotes to fall toward 1.13250-1.13000.
Alternatively, the quotes can grow toward 1.14000-1.14200.
The GBP/USD currency pair
Technical indicators of the currency pair:
Prev Open: 1.32614
Open: 1.32476
% chg. over the last day: -0.44
Day’s range: 1.32246 – 1.32514
52 wk range: 1.2438 – 1.4378
GBP/USD stabilized after the sharp rally last week. The demand for GBP has grown after statements from the UK Prime Minister. Theresa May mentioned that British parliamentaries could vote to postpone Brexit. Right now the quotes are consolidating and a technical correction is possible soon. The local support and resistance levels are 1.32150 and 1.32450. You should open positions from these levels and watch the Brexit news feed closely.
At 11:30 (GMT+2:00) the UK will publish the Construction PMI.
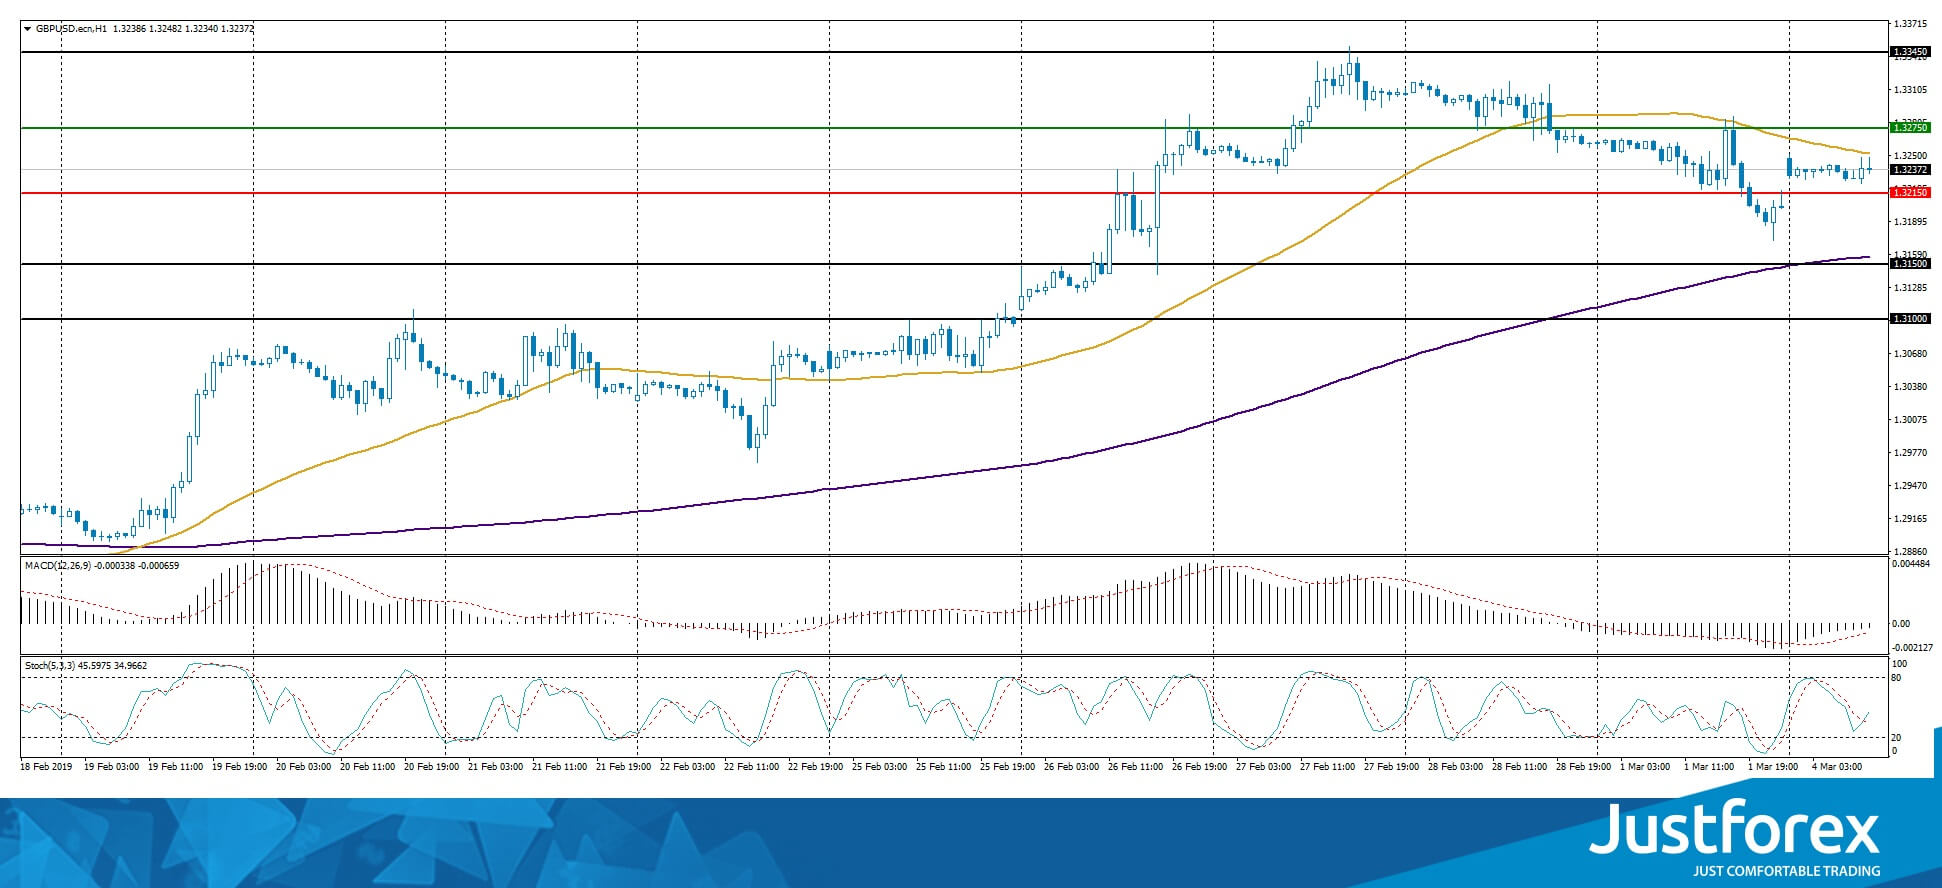
Indicators do not provide precise signals, the price fixed between 50 MA and 200 MA.
The MACD histogram is close to 0.
The Stochastic Oscillator is in the neutral zone, the %K line is crossing the %D line. There are no signals at the moment.
Trading recommendations
Support levels: 1.32150, 1.31500, 1.31000
Resistance levels: 1.32750, 1.33450, 1.34000
If the price fixes below 1.32150, expect the quotes to correct toward 1.31600-1.31400.
Alternatively, the quotes can grow toward 1.33300-1.33500.
The USD/CAD currency pair
Technical indicators of the currency pair:
Prev Open: 1.31690
Open: 1.32756
% chg. over the last day: +0.97
Day’s range: 1.32737 – 1.33022
52 wk range: 1.2248 – 1.3664
On Friday USD/CAD was in an aggressive buyout. CAD was weakened against the USD by 1% and the quotes reached the round 1.33000. The Statistical Service of Canada published a weak GDP report. According to it, in the fourth quarter the economic growth slowed to 0.1%, in comparison to the previous value of 0.5%. Right now the quotes are consolidating around 1.32700-1.33050. You should open positions from these levels. The trading instrument has further growth prospects.
The Economic News Feed for 04.03.2019 is calm.
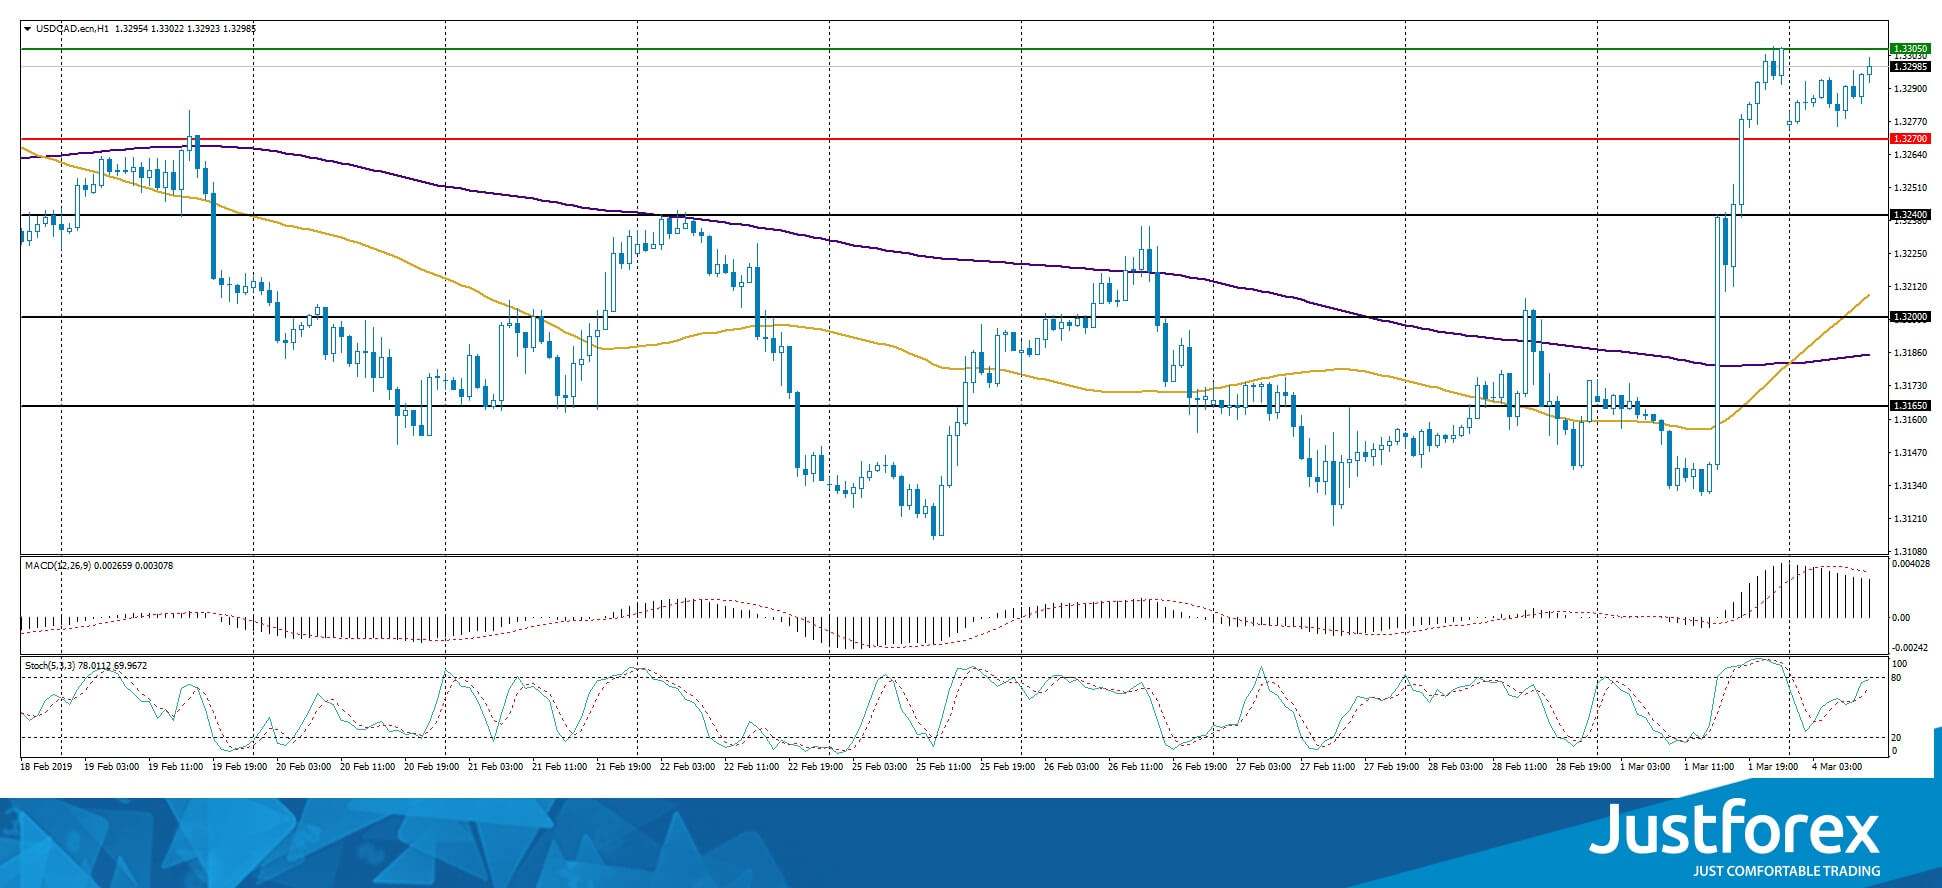
The price fixed above 50 MA and 200 MA which points to the power of the buyers.
The MACD histogram is in the positive zone, the %K line is above the %D line, which points to the bullish mood.
The Stochastic Oscillator is in the neutral zone, the %K line is above the %D line which points to the bullish mood.
Trading recommendations
Support levels: 1.32700, 1.32400, 1.32000
Resistance levels: 1.33050, 1.33500
If the price fixes above 1.33050, expect further growth of USD/CAD. The movement will tend toward 1.33400-1.33600.
Alternatively, the quotes can correct toward 1.32400-1.32200.
The USD/JPY currency pair
Technical indicators of the currency pair:
Prev Open: 111.375
Open: 111.841
% chg. over the last day: +0.48
Day’s range: 111.755 – 112.014
52 wk range: 104.56 – 114.56
USD/JPY is consolidating after the long rally last week. The quotes are testing the local levels of 111.750 and 112.000. A technical correction is possible soon. Keep an eye on the US Treasury bonds dynamic. You should open positions from the key levels.
The Economic News Feed for 04.03.2019 is calm.
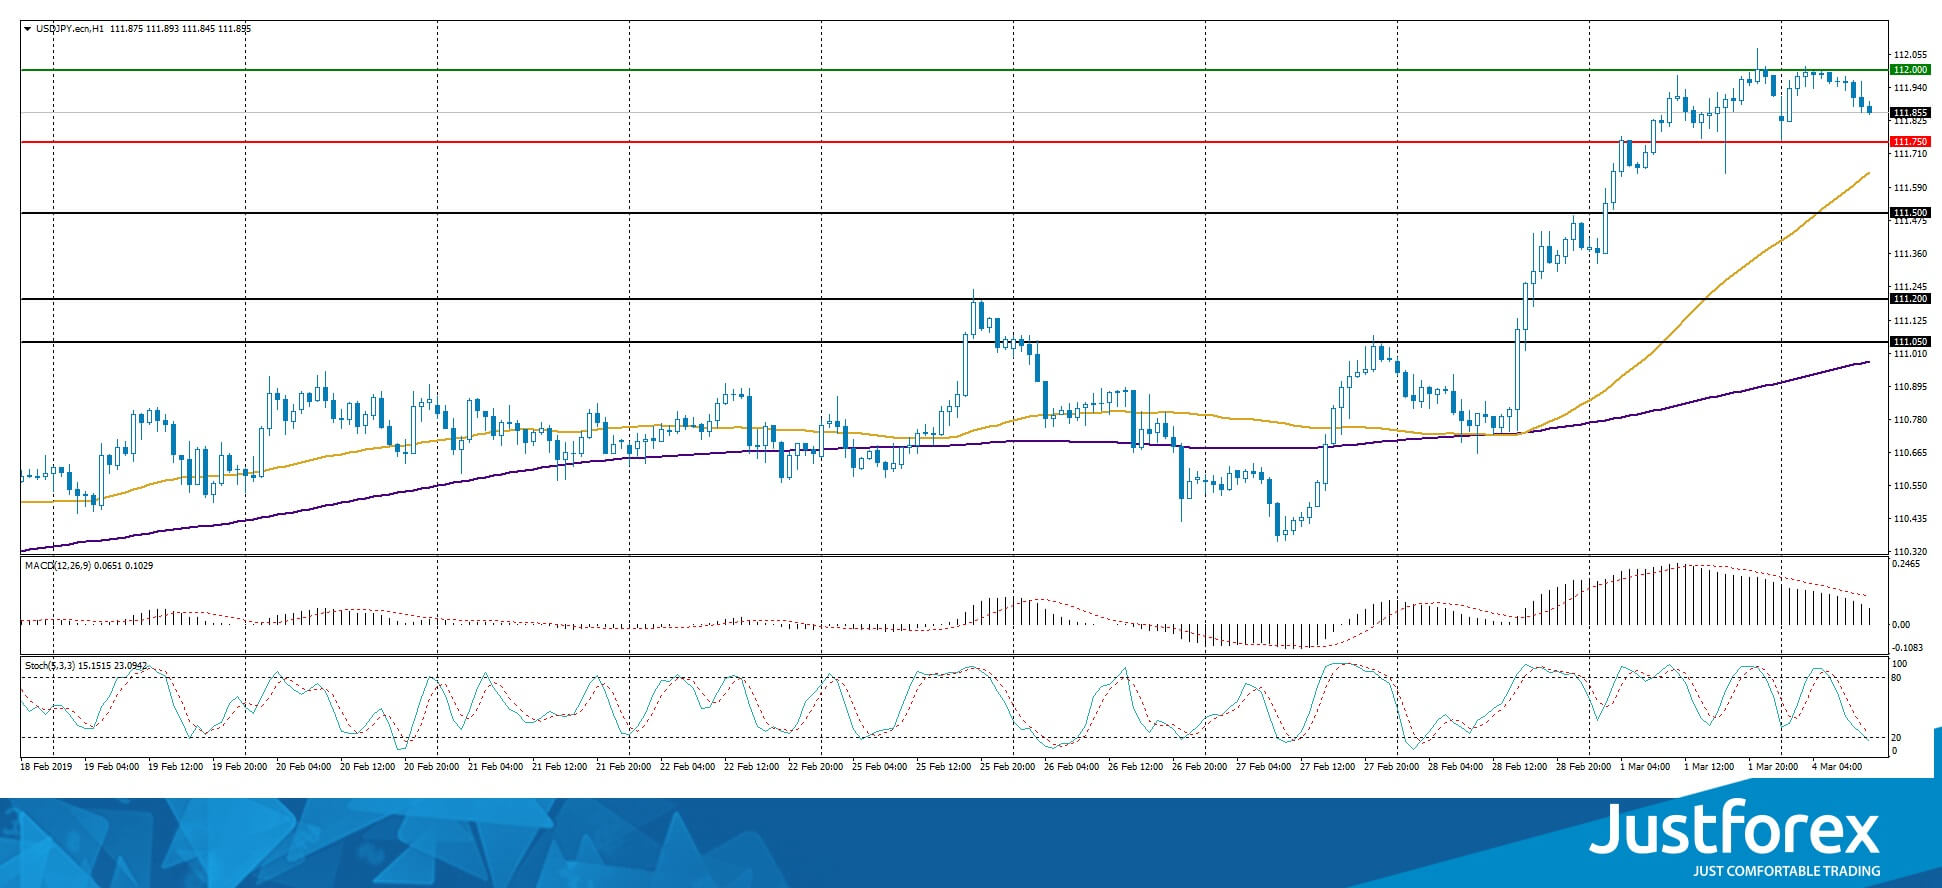
The price fixed above 50 MA and 200 MA which points to the power of the buyers.
The MACD histogram is in the positive zone but below the signal line, which gives a weak signal to buy USD/JPY.
The Stochastic Oscillator is in the neutral zone, the %K line is below the %D line which points toward the correction of USD/JPY quotes.
Trading recommendations
Support levels: 111.750, 111.500, 111.200
Resistance levels: 112.000, 112.500
If the price fixes above the round 112.000, expect the quotes to grow toward 112.400-112.600.
Alternatively, the quotes can correct toward 111.500-111.300.


