
The EUR/USD currency pair
Technical indicators of the currency pair:
Prev Open: 1.13073
Open: 1.13068
% chg. over the last day: -0.03
Day’s range: 1.13011 – 1.13157
52 wk range: 1.1214 – 1.2557
EUR has stabilized. The financial market participants are waiting for the Central Bank meeting. The regulator is supposed to leave the interest rate without changes. Keep an eye on the comments and rhetorics by the CBE representatives. The bank is also discussing the possibility of renewal of the long-term credit operations TLTRO to stimulate the European economy. The EUR/USD currency pair is consolidating around 1.12900-1.13200. You should open positions from these levels.
At 14:45 (GMT+2:00) CBE will declare the new key interest rate.
GDP Report (EU) – 12:00 (GMT+2:00);
Report on primary unemployment benefits requests (US) – 15:30 (GMT+2:00);
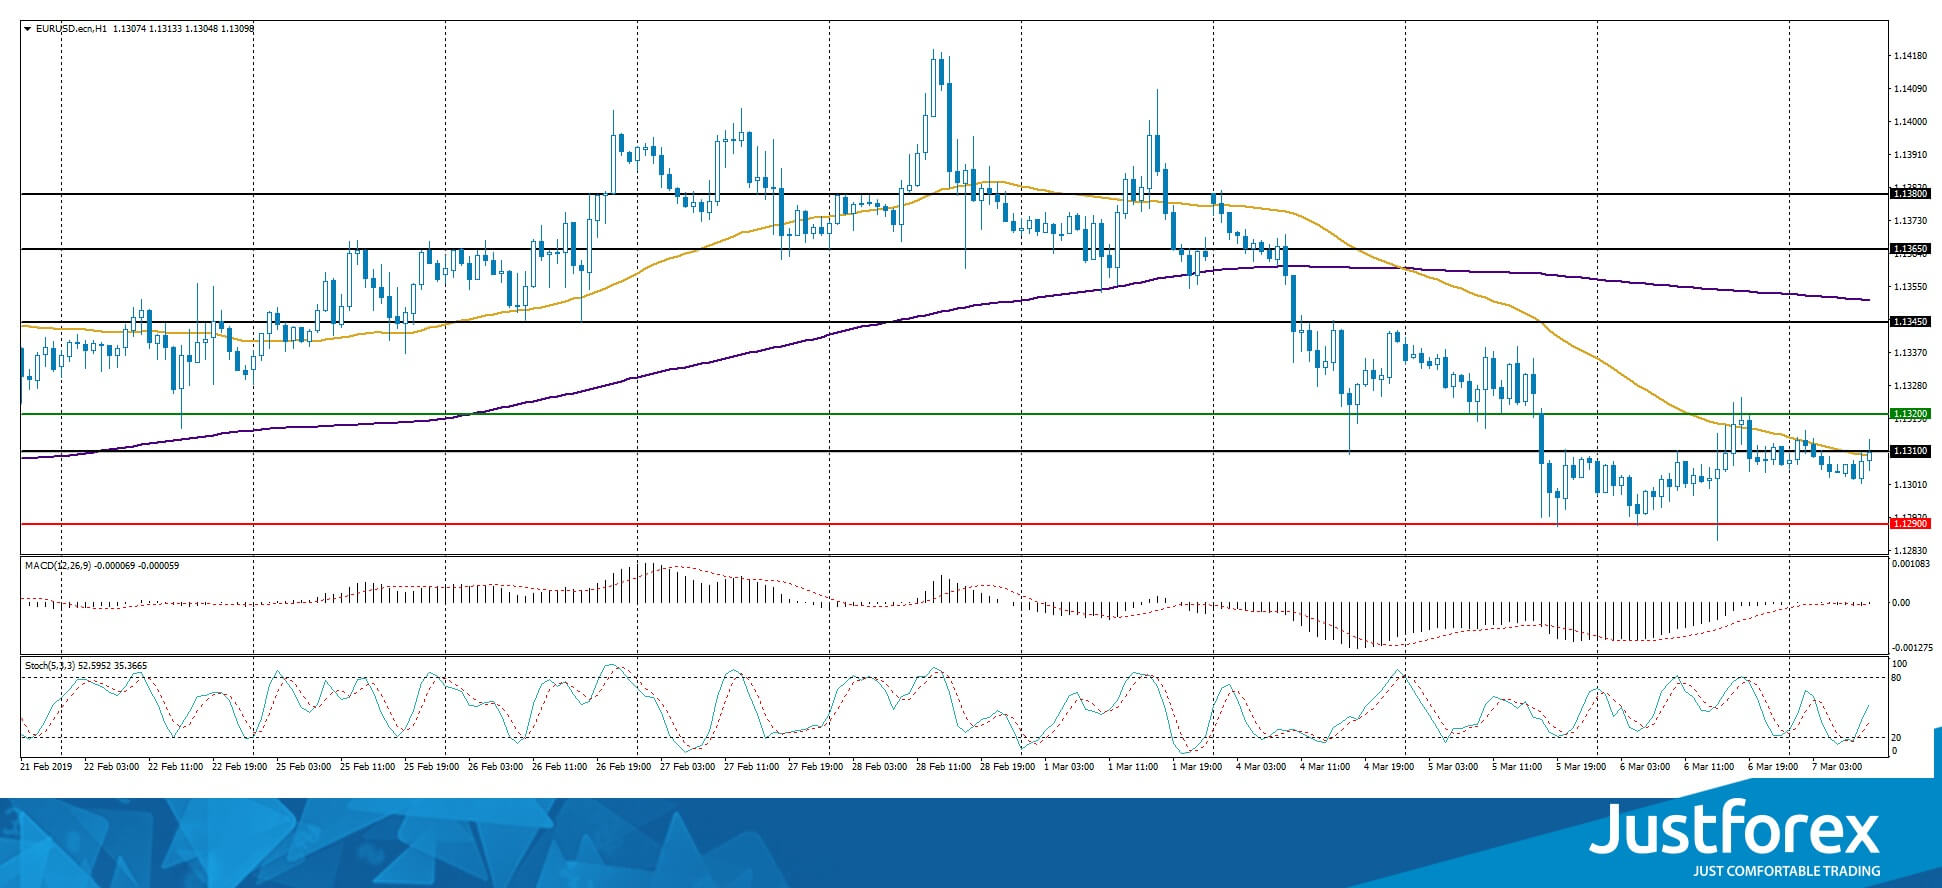
The indicators do not provide precise signals, the price has crossed 50 MA.
The MACD histogram is close to 0.
The Stochastic Oscillator is in the neutral zone, the %K line is above the %D line, which points to the bullish mood.
Trading recommendations
Support levels: 1.12900, 1.12500
Resistance levels: 1.13200, 1.13450, 1.13650
If the price fixes below the support level of 1.12900, expect the quotes to fall toward 1.12500-1.12300.
Alternatively, the quotes can grow toward 1.13500-1.13700.
The GBP/USD currency pair
Technical indicators of the currency pair:
Prev Open: 1.31729
Open: 1.31690
% chg. over the last day: +0.18
Day’s range: 1.31586 – 1.31846
52 wk range: 1.2438 – 1.4378
GBP/USD has stabilized. The financial market participants are waiting for the new info regarding Brexit. The quotes have stabilized around 1.31350 and 1.31850. The trading instrument started to descend. The demand for the USD remains high. You should open positions from these levels.
The Economic News Feed for 07.03.2019 is calm.
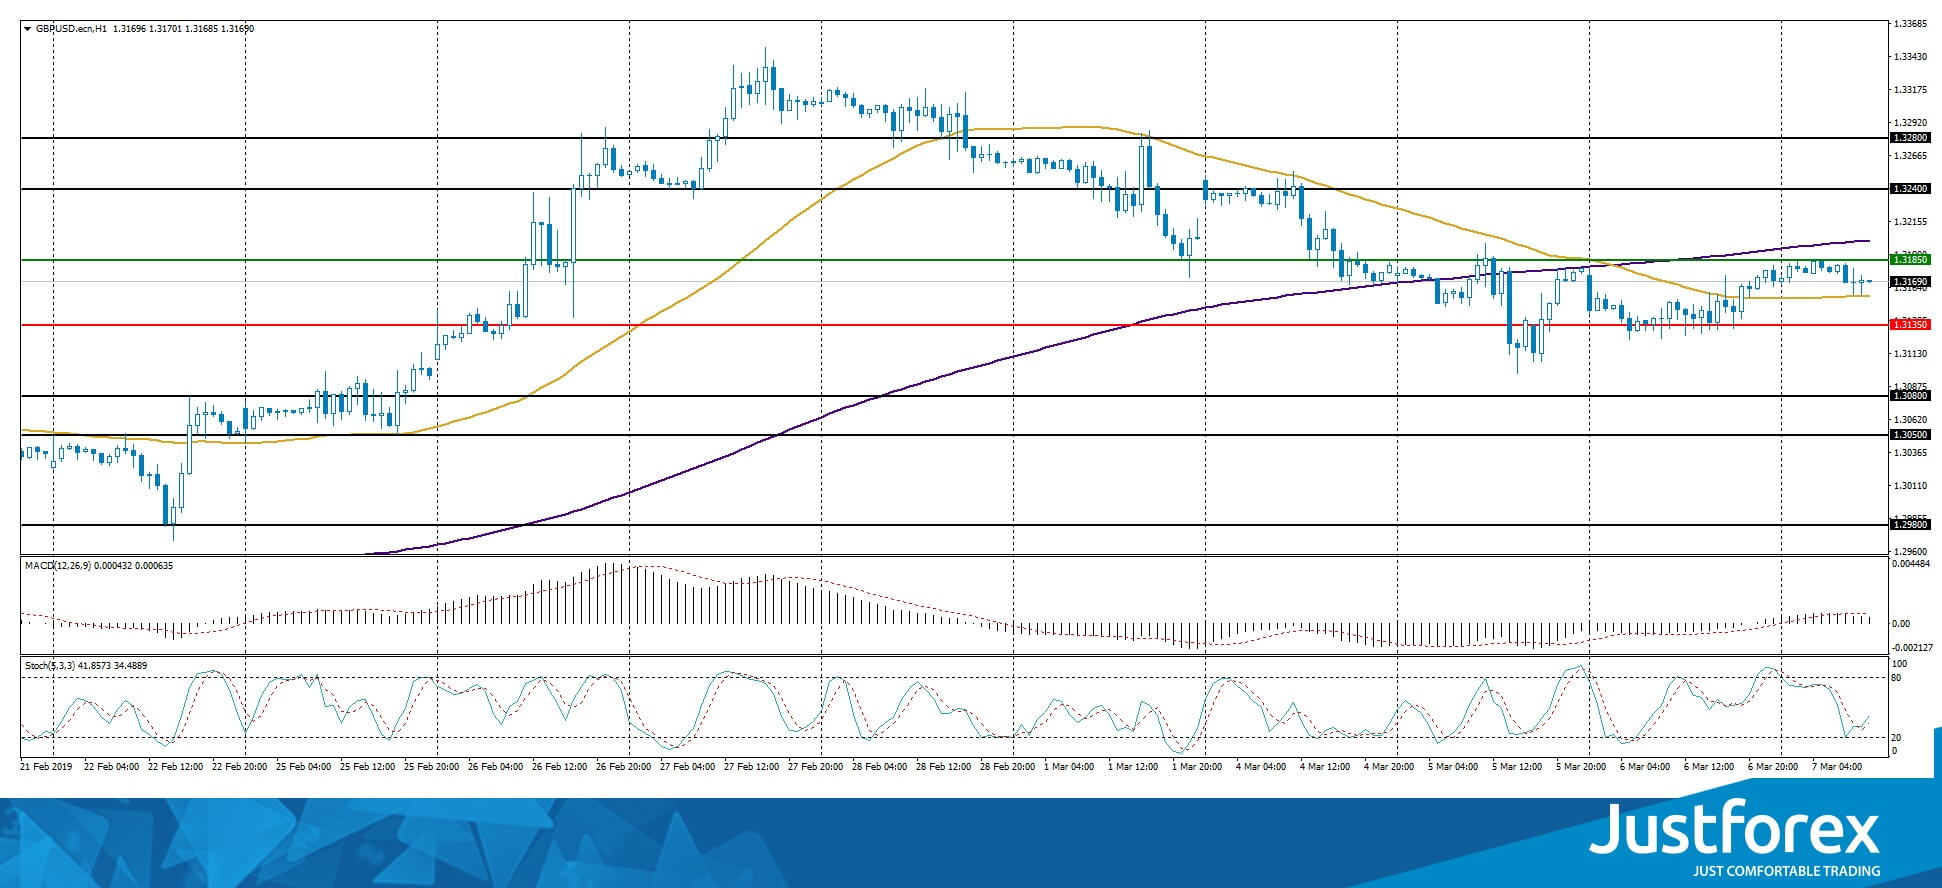
The indicators do not provide precise signals, the price fixed between 50 MA and 200 MA.
The MACD histogram is in the positive zone but below the signal line, which gives a weak signal to buy GBP/USD.
The Stochastic Oscillator is in the neutral zone, the %K line is above the %D line which points to a bullish mood.
Trading recommendations
Support levels: 1.31350, 1.30800, 1.30500
Resistance levels: 1.31850, 1.32400, 1.32800
If the price fixes below 1.31350, expect the quotes to fall toward 1.30800-1.30500.
Alternatively, the quotes can grow toward 1.32300-1.32600.
The USD/CAD currency pair
Technical indicators of the currency pair:
Prev Open: 1.33502
Open: 1.34366
% chg. over the last day: +0.66
Day’s range: 1.34299 – 1.34471
52 wk range: 1.2248 – 1.3664
CAD started losing positions yesterday, since Bank of Canada kept the monetary positions at the same level. The regulator is worried about the economic situation in the country and is not going to raise the rates any time soon. An additional pressure on CAD is caused by weak economic reports from canada. Right now the quotes are consolidating around 1.34150-1.34500. You should open positions from these levels.
The Economic News Feed for 07.03.2019 is calm. At 15:30 (GMT+2:00) Canada will publish a report on the building permissions.
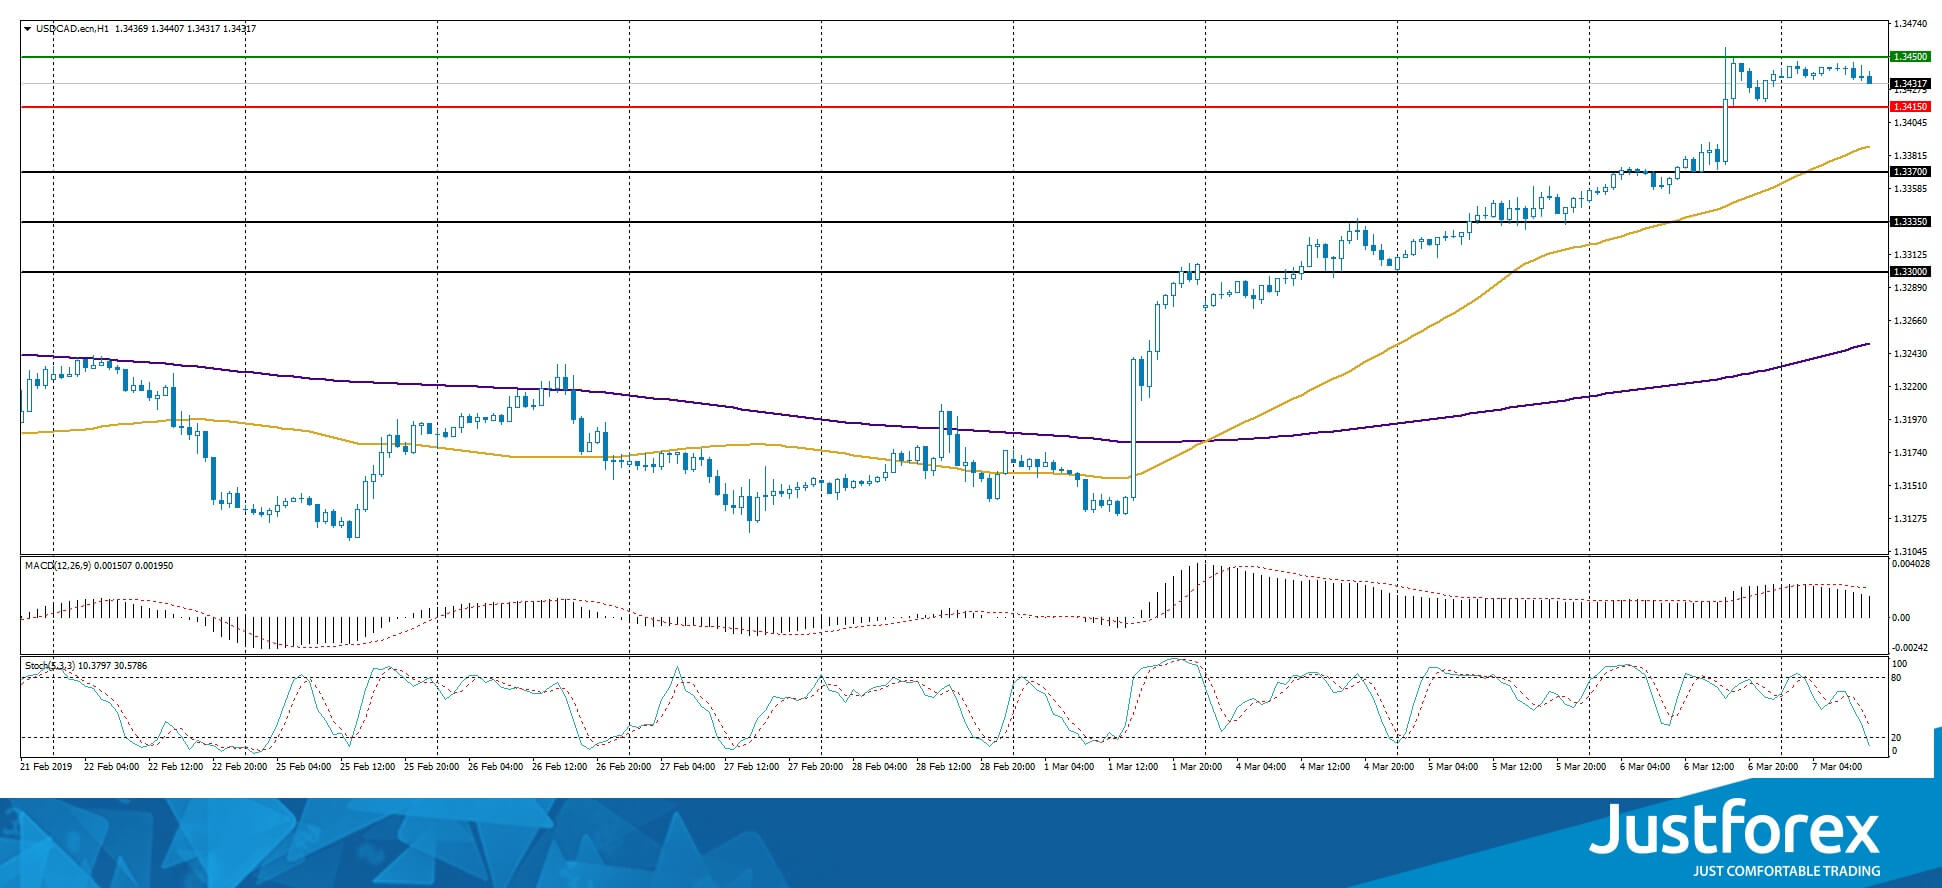
The price fixed above 50 MA and 200 MA, which points to the power of the buyers.
The MACD histogram is in the positive zone but below the signal line, which points toward the correction of the USD/CAD quotes.
The Stochastic Oscillator is in the neutral zone, the %K line is below the %D line, which points toward the correction of USD/CAD.
Trading recommendations
Support levels: 1.34150, 1.33700, 1.33350
Resistance levels: 1.34500, 1.35000
If the price fixes above 1.34500, expect tje qiptes to grow toward 1.35000.
Alternatively, the quotes can correct toward 1.33800-1.33600.
The USD/JPY currency pair
Technical indicators of the currency pair:
Prev Open: 111.849
Open: 111.765
% chg. over the last day: -0.21
Day’s range: 111.575 – 111.800
52 wk range: 104.56 – 114.56
USD/JPY keeps moving sideways. There is no single defined trend. The investors are waiting for additional drivers. The demand for the safe haven currencies remains before the ECB meeting today and the US Labour Market report for December set to release on March 8. The local support and resistance levels are 111.550 and 111.800. You should open positions from these levels.
The Economic News Feed for 07.03.2019 is calm.
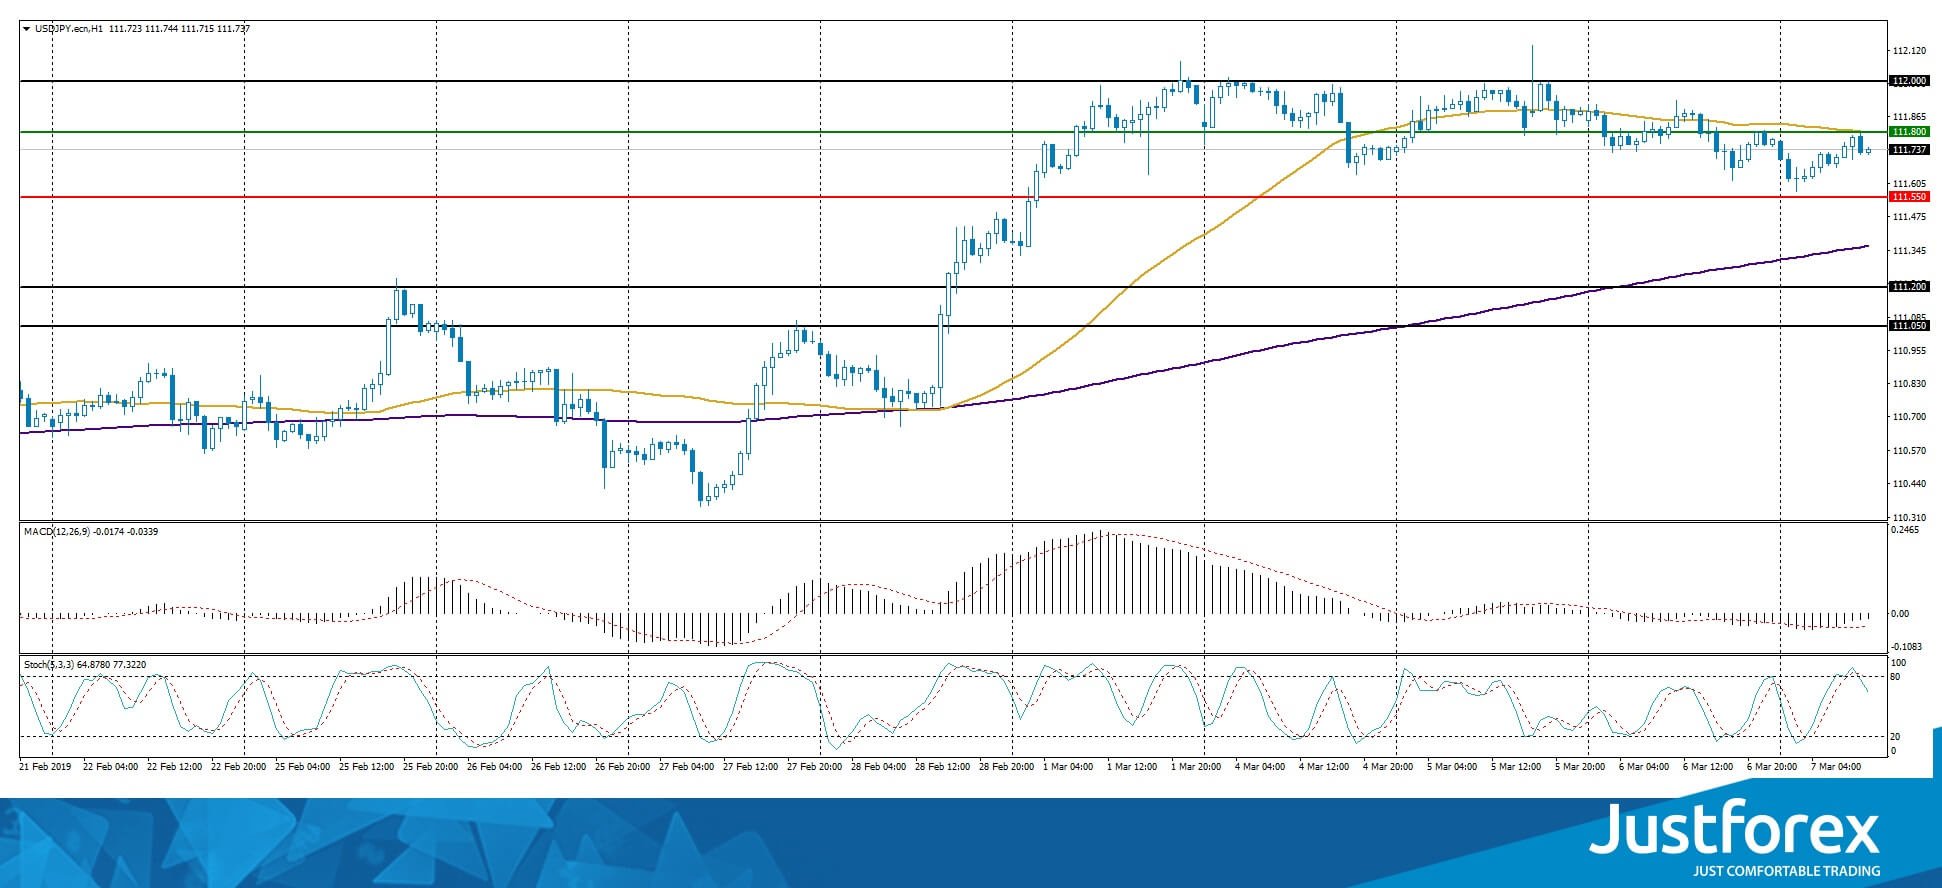
The indicators do not provide precise signals, the price fixed between 50 MA and 200 MA.
The MACD histogram is in the negative zone but above the signal line, which points toward selling USD/JPY.
The Stochastic Oscillator is near the overbought zone, the %K line is crossing the %D line. There are no signals at the moment.
Trading recommendations
Support levels: 111.550, 111.200, 111.050
Resistance levels: 111.800, 112.000, 112.500
If the price fixed below 111.500, expect the quotes to fall toward 111.250-111.000.
Alternatively, the quotes can correct toward 112.000-112.300.


