
The EUR/USD currency pair
Technical indicators of the currency pair:
Prev Open: 1.12038
Open: 1.12189
% chg. over the last day: +0.13
Day’s range: 1.12173 – 1.12365
52 wk range: 1.1214 – 1.2557
EUR/USD has stabilized. There is no defined trend, the investors are waiting the US labour market report for March. This report can influence all major currencies so keep an eye on the difference between forecasted and real-life indicator values. EUR is also under pressure after the last ECB meeting regarding monetary policy. The regulator is reviewing additional economy-stimulating measures. The Central Bank does not intend to increase the interest rates until the end of the year. Right now the local support and resistance levels are 1.12100 and 1.12350.
The Economic News Feed for 05.04.2019:
Labour Market Report (US) – 15:30 (GMT+3:00);
Also keep an eye on the relevant data regarding the US/China trading negotiations. Donald Trump stated on Thursday that both sides are close to an agreement which could be announced in the next four weeks.

The indicators do not provide precise data, the price has crossed 50 MA and 200 MA.
The MACD histogram is close to 0.
The Stochastic Oscillator is in the neutral zone, the %K line is crossing the %D line. There are no signals at the moment.
Trading recommendations
Support levels: 1.12100, 1.11850, 1.11500
Resistance levels: 1.12350, 1.12550, 1.12800
If the price fixes at 1.12100, expect the quotes to fall toward 1.11800-1.11500.
Alternatively, the quotes can recover toward 1.13000.
The GBP/USD currency pair
Technical indicators of the currency pair:
Prev Open: 1.31545
Open: 1.30733
% chg. over the last day: -0.66
Day’s range: 1.30666 – 1.31218
52 wk range: 1.2438 – 1.4378
GBP/USD is in an agressive sell-off. GBP has lost more than 85 points and updated the local minimums. The financial market participants keep watching the Brexit situation. The House of Commons have voted for postponing Brexit. According to Reuters, GBP is set to grow by 3% when the Brexit issue is resolved. Right now the key range is 1.30600-1.31200. You should open positions from these levels and wait for the US Labour Market Report.
The Economic News Feed for 05.04.2019 is calm.
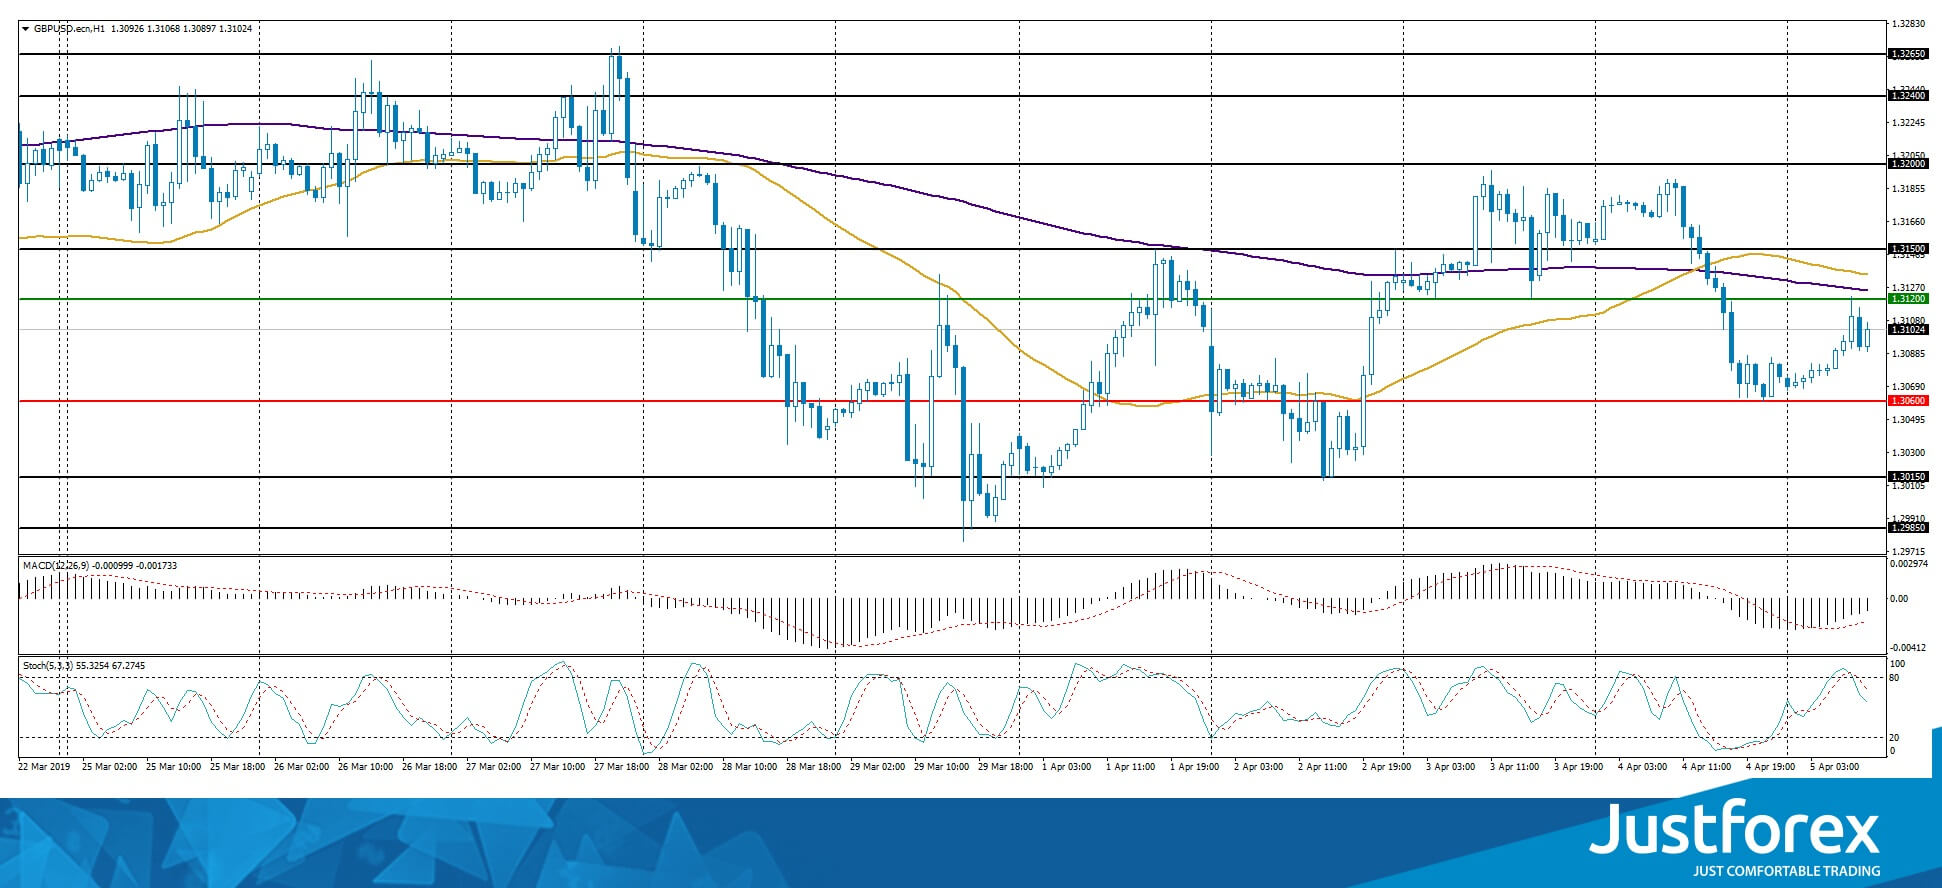
The indicators do not provide precise signals, 50 MA started to cross 200 MA.
The MACD histogram is in the negative zone but above the signal line, which gives a weak signal to sell GBP/USD.
The Stochastic Oscillator is in the neutral zone, the %K line is below the %D line which points to the bearish mood.
Trading recommendations
Support levels: 1.30600, 1.30150, 1.29850
Resistance levels: 1.31200, 1.31500, 1.32000
If 1.31200, expect further growth toward 1.32000.
Alternatively, the quotes can fall toward 1.30400-1.30000.
The USD/CAD currency pair
Technical indicators of the currency pair:
Prev Open: 1.33425
Open: 1.33581
% chg. over the last day: +0.31
Day’s range: 1.33488 – 1.33673
52 wk range: 1.2248 – 1.3664
USD/CAD keeps trading in a flat. There is no defined trend. Right now the investors are waiting for important economic releases. At 15:30 (GMT+3:00) the US and Canada will publish a Labour Market report for March. The key support and resistance levels are 1.33400 and 1.33750. You should open position from these levels.
CAD is supported by the positive business activity’s reports by Ivy.
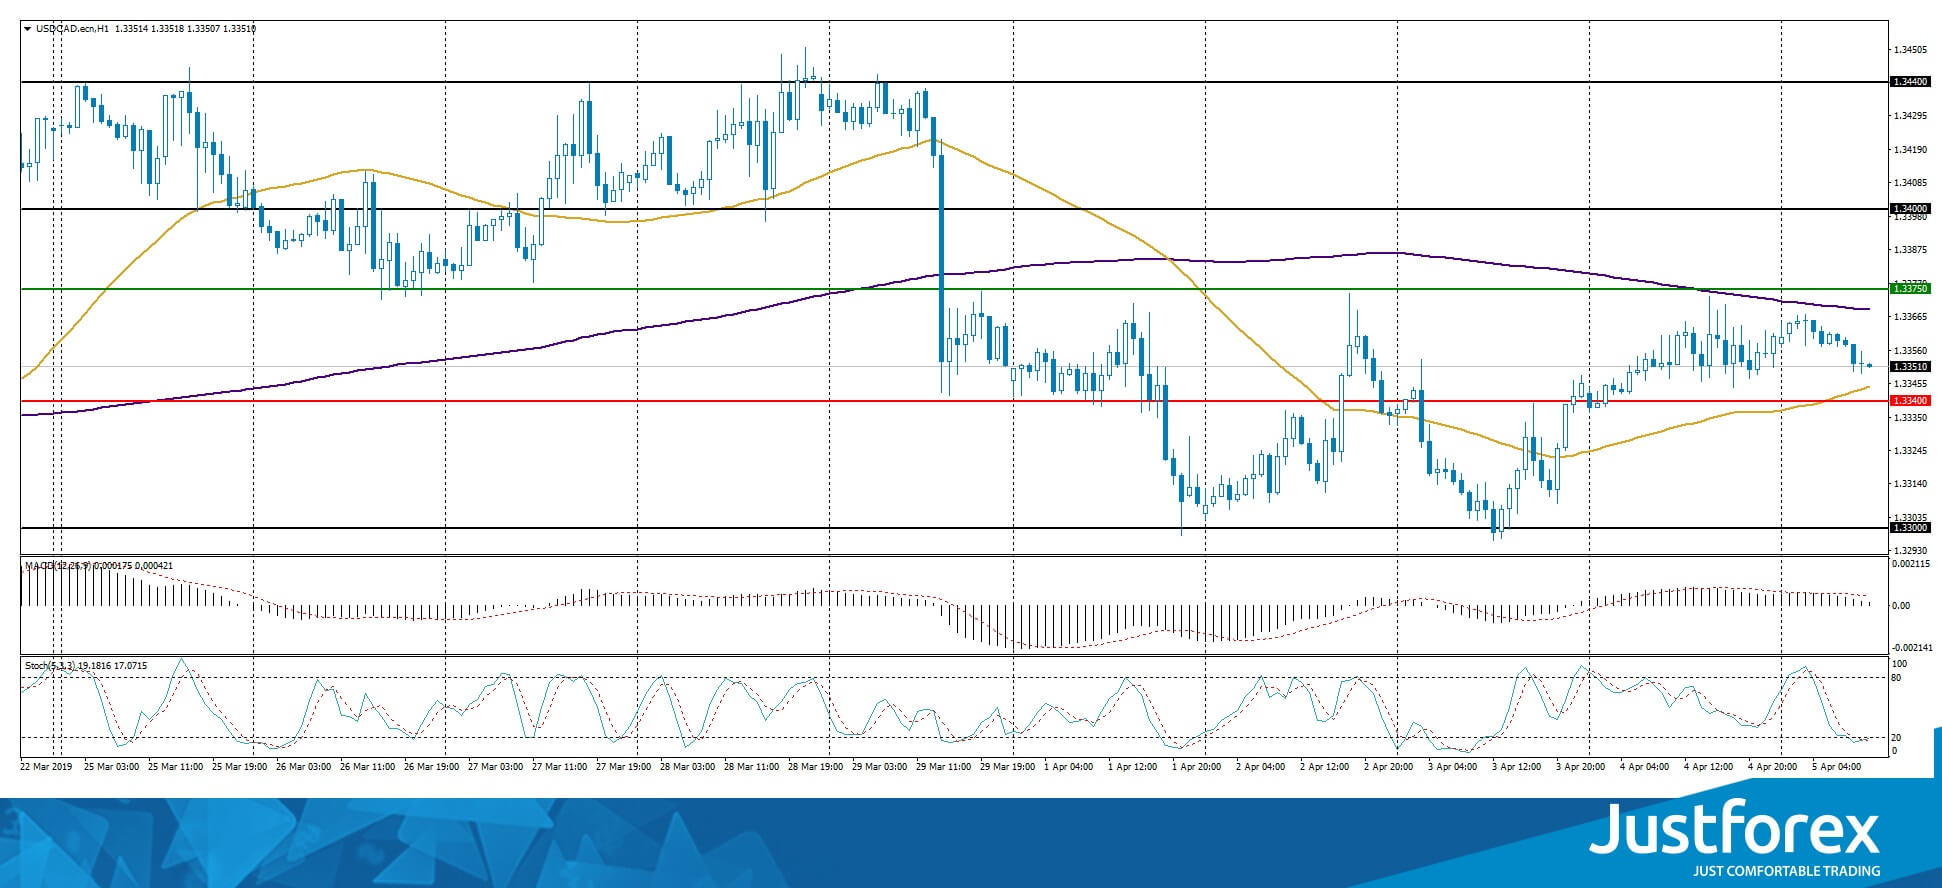
The indicators do not provide precise signals, the price fixed between 50 MA and 200 MA.
The MACD histogram is close to .
The Stochastic Oscillator is close to the oversold zone, the %K line is crossing the %D line. There are no signals at the moment.
Trading recommendations
Support levels: 1.33400, 1.33000
Resistance levels: 1.33750, 1.34000, 1.34400
If the price fixes below 1.33400, consider selling USD/CAD, the price is expected to fall toward 1.33000.
Alternatively, the quotes can grow toward 1.33900-1.34200.
The USD/JPY currency pair
Technical indicators of the currency pair:
Prev Open: 111.454
Open: 111.643
% chg. over the last day: +0.16
Day’s range: 111.596 – 111.800
52 wk range: 104.56 – 114.56
USD/JPY keeps showing a bullish mood. Yesterday the quotes updated the local maximums. The trading instrument found the resistance at 111.750. 111.450 acts as a mirror support. The demand for safe haven currencies is weakened due to productive US/China negotiations. Right now the financial market participants are waiting for the US Labour Market report. Keep an eye on the US Treasury bonds’ yield and open positions from the key levels.
The Economic News Feed for 05.04.2019 is calm.
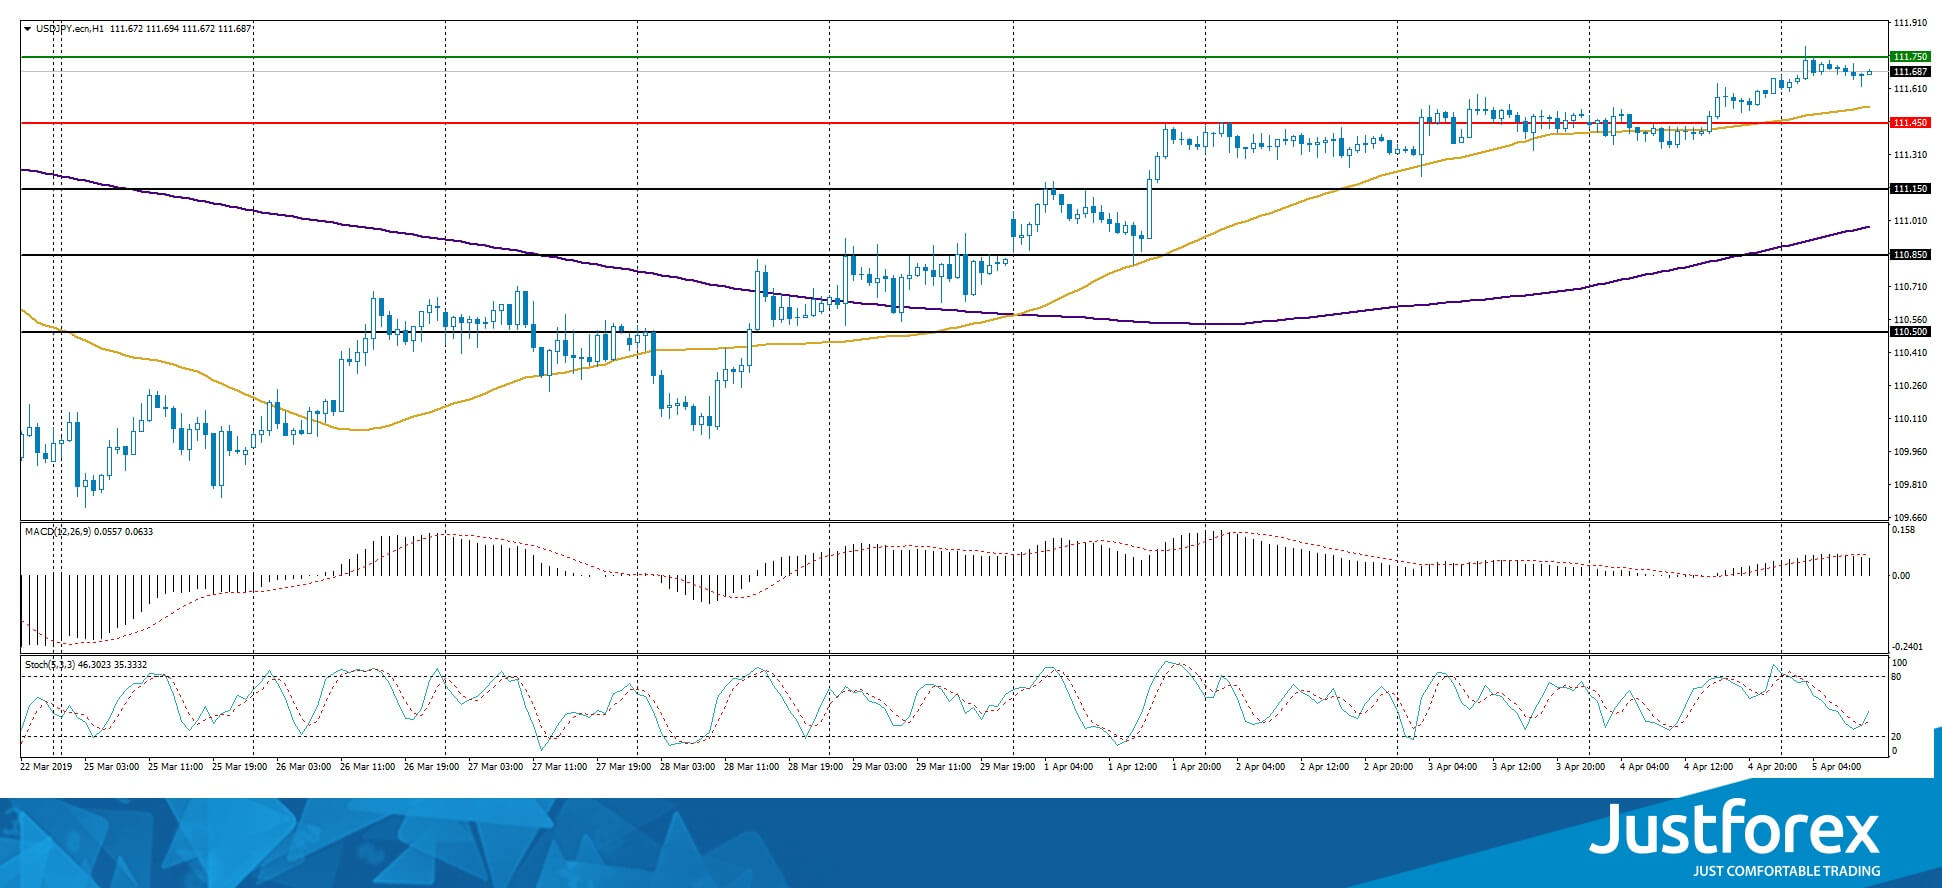
The indicators point to the power of the buyers, the price fixed above 50 MA and 200 MA.
The MACD histogram is in the positive zone but below the signal line which gives a weak signal to buy USD/JPY.
The Stochastic Oscillator is in the neutral zone, the %K line is above the %D line which points to the bullish mood.
Trading recommendations
Support levels: 111.450, 111.150, 110.850
Resistance levels: 111.750, 112.000
If the price fixes above 111.750, expect further growth toward 112.250-112.500.
Alternatively, the quotes can fall toward 111.000.


