
The EUR/USD currency pair
Technical indicators of the currency pair:
Prev Open: 1.11713
Open: 1.11659
% chg. over the last day: +0.21
Day’s range: 1.11583 – 1.11775
52 wk range: 1.1111 – 1.2009
On Friday US published mixed reports on the Labour Market for April. The non-agrarian industry created 263 000 workplaces which is much higher than expected. The unemployment lowered to 3.6% – the 49-year minimum. At the same time, the average hourly wage grew only by 0.2%, which is lower than expected 0.3%. The economically active population lowered from 63% to 62.8%. The ISM’s non-industrial business activity index slowed down from 56.1 to 55.5.
The trading conflict between Washington and Beijing in once again in the foreground. Donald Trump tweeted that on Friday the Chinese wares worth more than 200 billion USD will have their fees increased from 10% to 25%. Keep an eye on this issue.
EUR/USD is consolidating around 1.11650-1.12000. Open positions from these marks.
At 11:00 (GMT+3:00) we expect an array of economic releases from the EU.
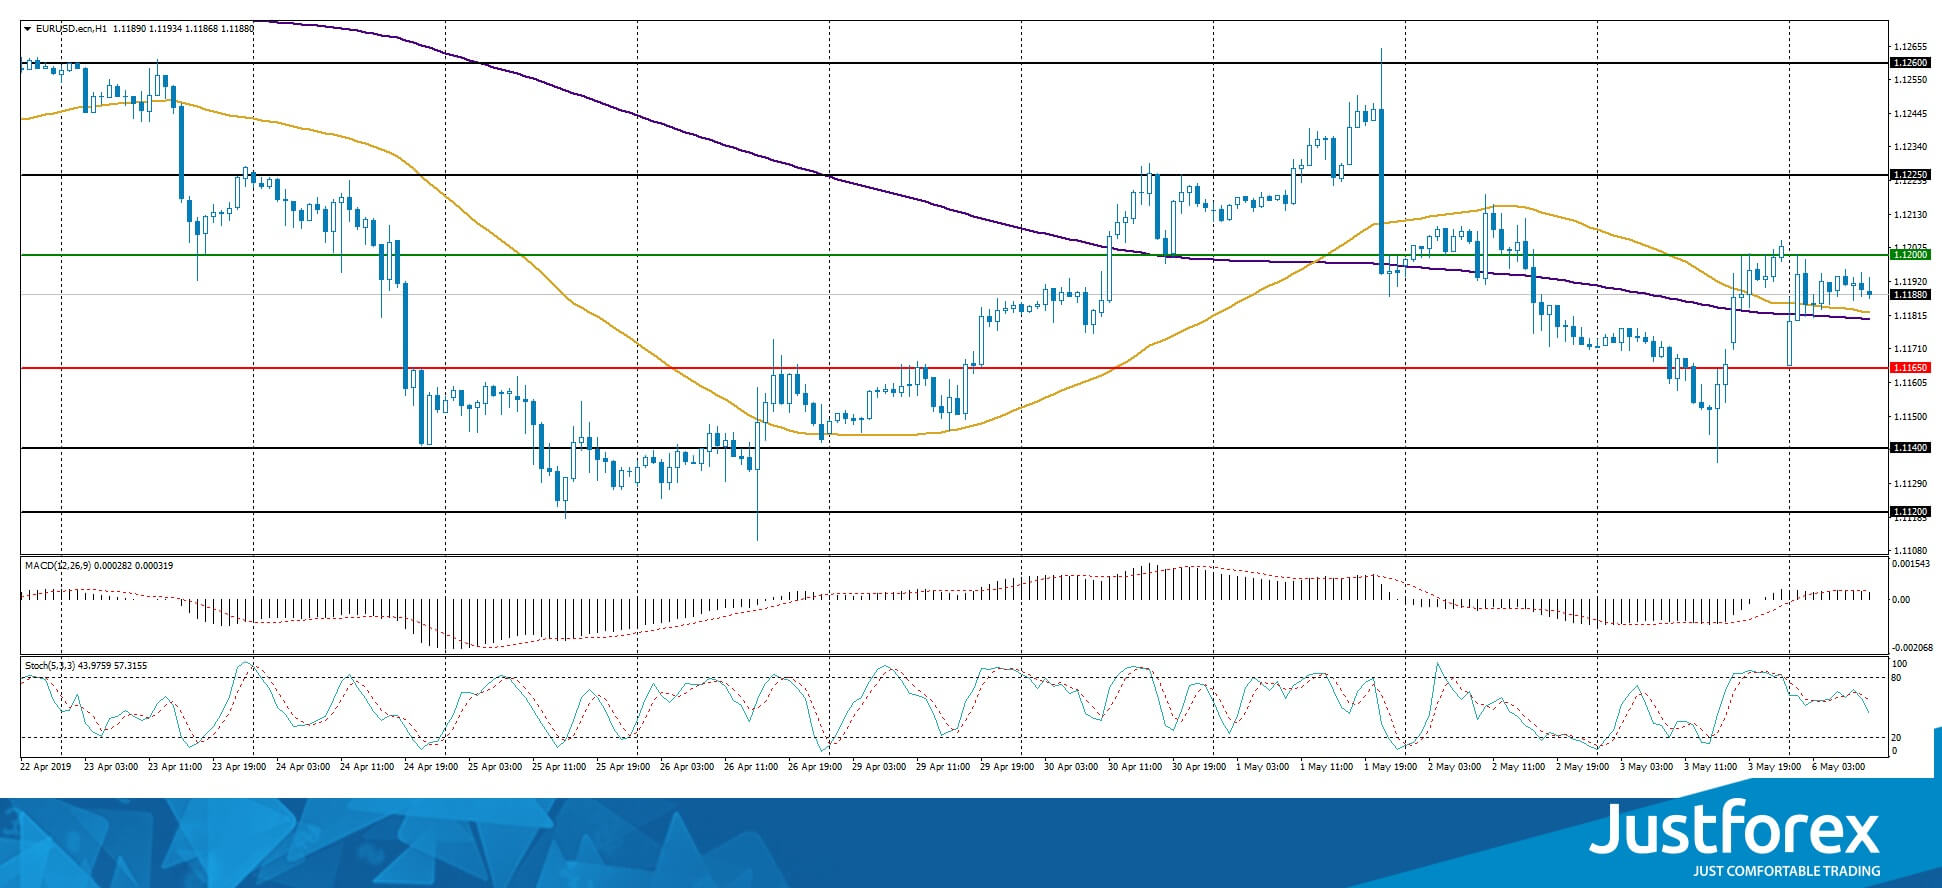
The indicators do not provide precise signals: 50 MA started to cross 200 MA.
The MACD histogram is in the positive zone but below the signal line which gives a weak signal to buy EUR/USD.
The Stochastic Oscillator is in the neutral zone, the %K line is below the %D line which points to the bearish mood.
Trading recommendations
Support levels: 1.11650, 1.11400, 1.11200
Resistance levels: 1.12000, 1.12250, 1.12600
If the price fixes below 1.11650, expect further descend toward 1.11400-1.11200.
Alternatively, the quotes can grow toward 1.12250-1.12500.
The GBP/USD currency pair
Technical indicators of the currency pair:
Prev Open: 1.30276
Open: 1.31371
% chg. over the last day: +1.07
Day’s range: 1.31102 – 1.31706
52 wk range: 1.2438 – 1.3631
GBP/USD had shown agressive sales on Friday. GBP updated the key maximums. Jeremy Corbin, the leader of the British Labour party made a statement that the Parliament should just “deal with it” and reach an agreement on Brexit. These comments gave GBP remarkable support. The quotes are currently consolidating around 1.31000-1.31400. You should open positions from these levels. Further growth is not out of question.
The British markets are currently closed due to a holiday.
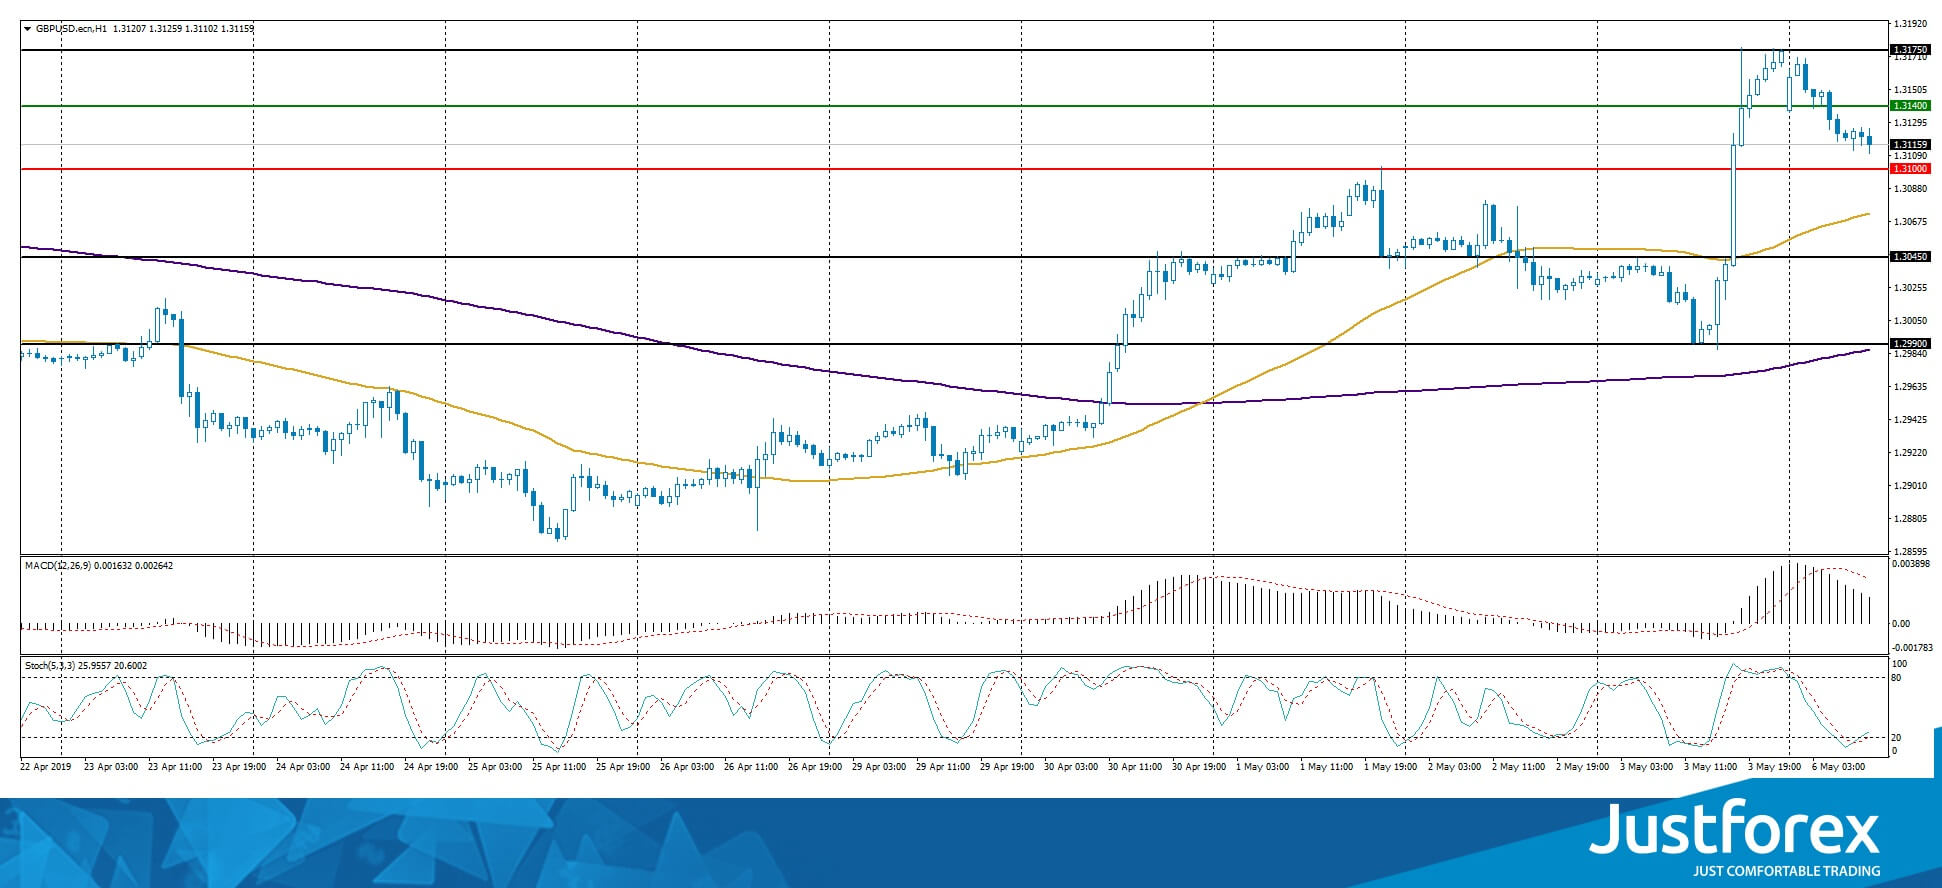
The price fixed above 50 MA and 200 MA which points to the power of the buyers.
The MACD histogram is in the positive zone but below the signal line which gives a weak signal to buy GBP/USD.
The Stochastic Oscillator started to leave the oversold zone, the %K line is above the %D line which points to the bullish mood.
Trading recommendations
Support levels: 1.31000, 1.30450, 1.29900
Resistance levels: 1.31400, 1.31750, 1.32000
If the price fixes above 1.31400, expect further growth toward 1.31750-1.32000.
Alternatively, the quotes can correct toward 1.30700-1.30500.
The USD/CAD currency pair
Technical indicators of the currency pair:
Prev Open: 1.34657
Open: 1.34559
% chg. over the last day: -0.41
Day’s range: 1.34544 – 1.34938
52 wk range: 1.2727 – 1.3664
USD/CAD shows an ambiguous technical picture. The CAD keeps consolidating. The key support and resistance levels are 1.34550 and 1.34900. The pressure on the CAD is caused by the weak oil quotes. The trading instrument can grow further. You should open positions from the key levels.
Keep an eye on the statements made by the Head of the Bank of Canada.
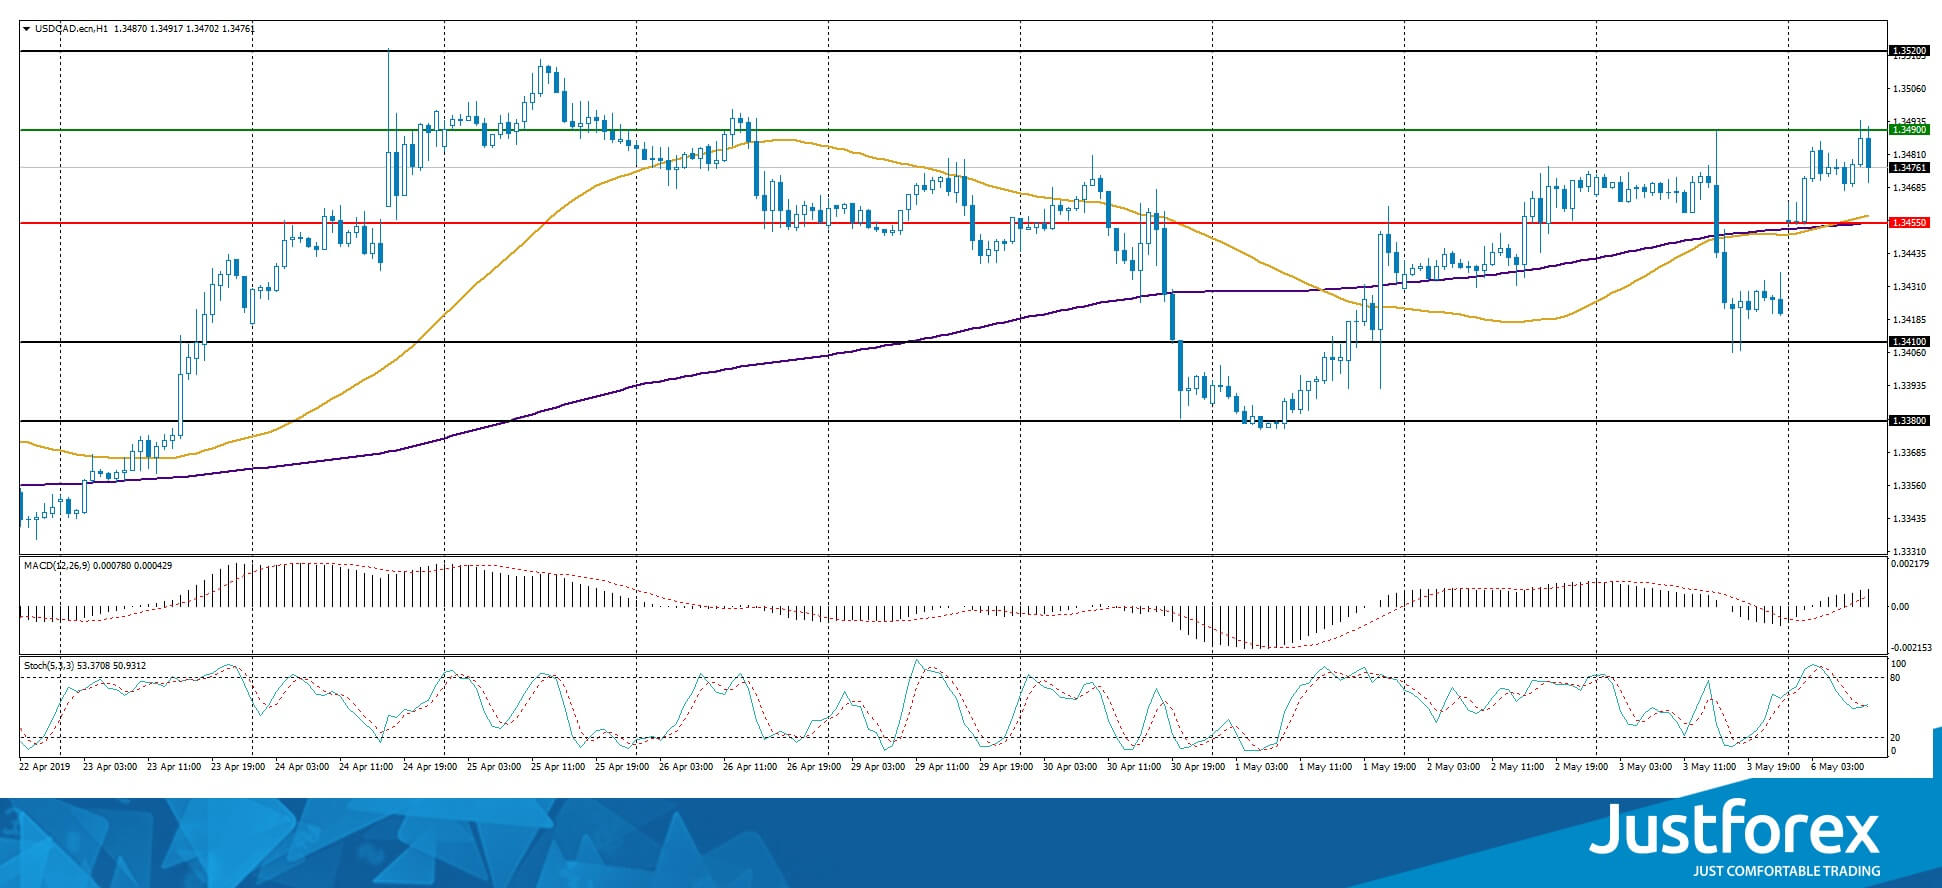
The indicators do not provide precise signals, 50 MA has crossed 200 MA.
The MACD histogram is in the positive zone but above the signal line which gives a strong signal towards buying USD/CAD.
The Stochastic Oscillator is in the neutral zone, the %K line is crossing the %D line. There are no signals at the moment.
Trading recommendations
Support levels: 1.34550, 1.34100, 1.33800
Resistance levels: 1.34900, 1.35200
If the price fixes above 1.34900, consider buying USD/CAD. The price is supposed to move toward 1.35200-1.35400.
Alternatively, the qutoes can descend toward 1.34200-1.34000.
The USD/JPY currency pair
Technical indicators of the currency pair:
Prev Open: 111.488
Open: 110.598
% chg. over the last day: -0.37
Day’s range: 110.284 – 110.844
52 wk range: 104.97 – 114.56
USD/JPY is in the bearish mood. The trading instrument opened with a gap down by 50 points and updated the local minimums. The demand for the safe currencies has grown due to the escalation of the US/China conflict. Keep an eye on this issue and open positions from the 110.600-110.850 levels. The currency pair can descend further.
Japanese financial markets are closed due to the holidays.
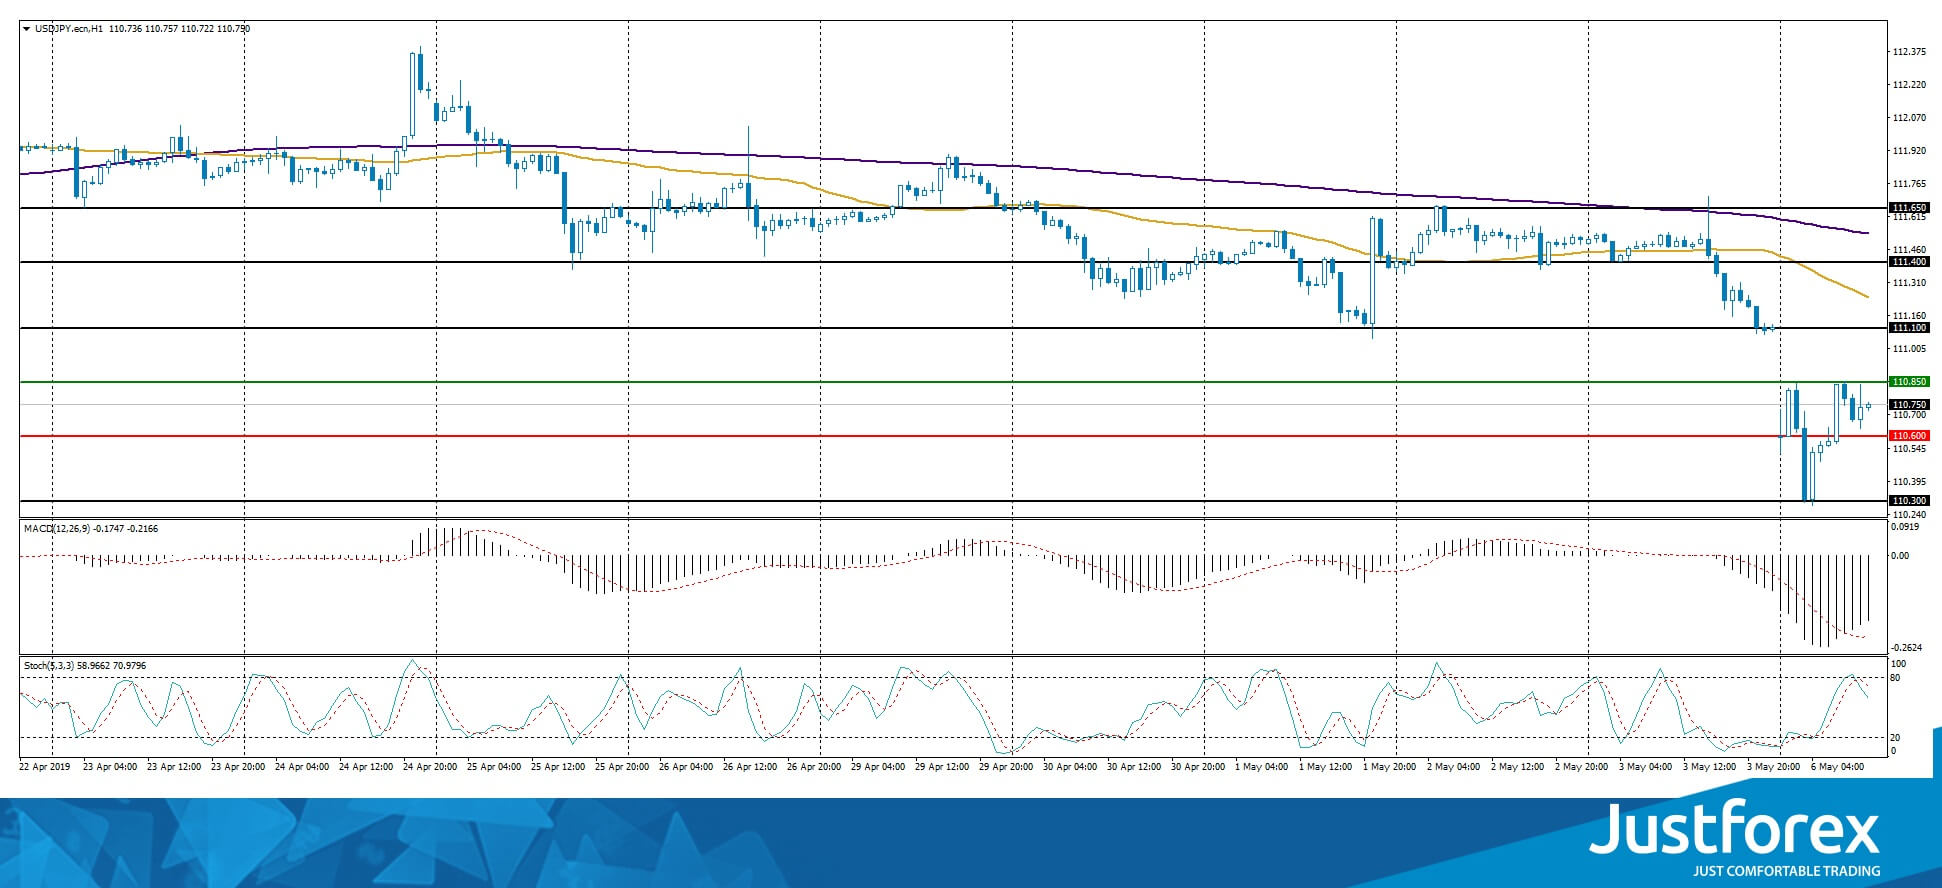
The price fixed below 50 MA and 200 MA which points to the power of the sellers..
The MACD histogram is in the negative zone which gives a weak signal to sell USD/JPY.
The Stochastic Oscillator is in the neutral zone, the %K line is below the %D line which points to the bearish mood.
Trading recommendations
Support levels: 110.600, 110.300, 110.000
Resistance levels: 110.850, 111.100, 111.400
If the price fixes below 110.600, expect it to descend toward 110.300-110.000.
Alternatively, the quotes can recover toward 111.100-111.300.


