
The EUR/USD currency pair
Technical indicators of the currency pair:
Prev Open: 1.11982
Open: 1.11897
% chg. over the last day: -0.09
Day’s range: 1.11877 – 1.12128
52 wk range: 1.1111 – 1.2009
EUR/USD retains an ambiguous technical picture. The financial market participants are waiting for additional drivers. The EU commission has decreased the expectations for the EU growth for 2019-2020. The trading conflict between the US and China remains in the spotlight. Chinese Vice-Premier Liu He will go to the United States on Thursday to continue trade negotiations. Right now the local support and resistance levels are 1.11900-1.12200. Open positions from these levels.
At 14:30 (GMT+3:00) the investors will evaluate the latest ECB meeting on monetary policy.
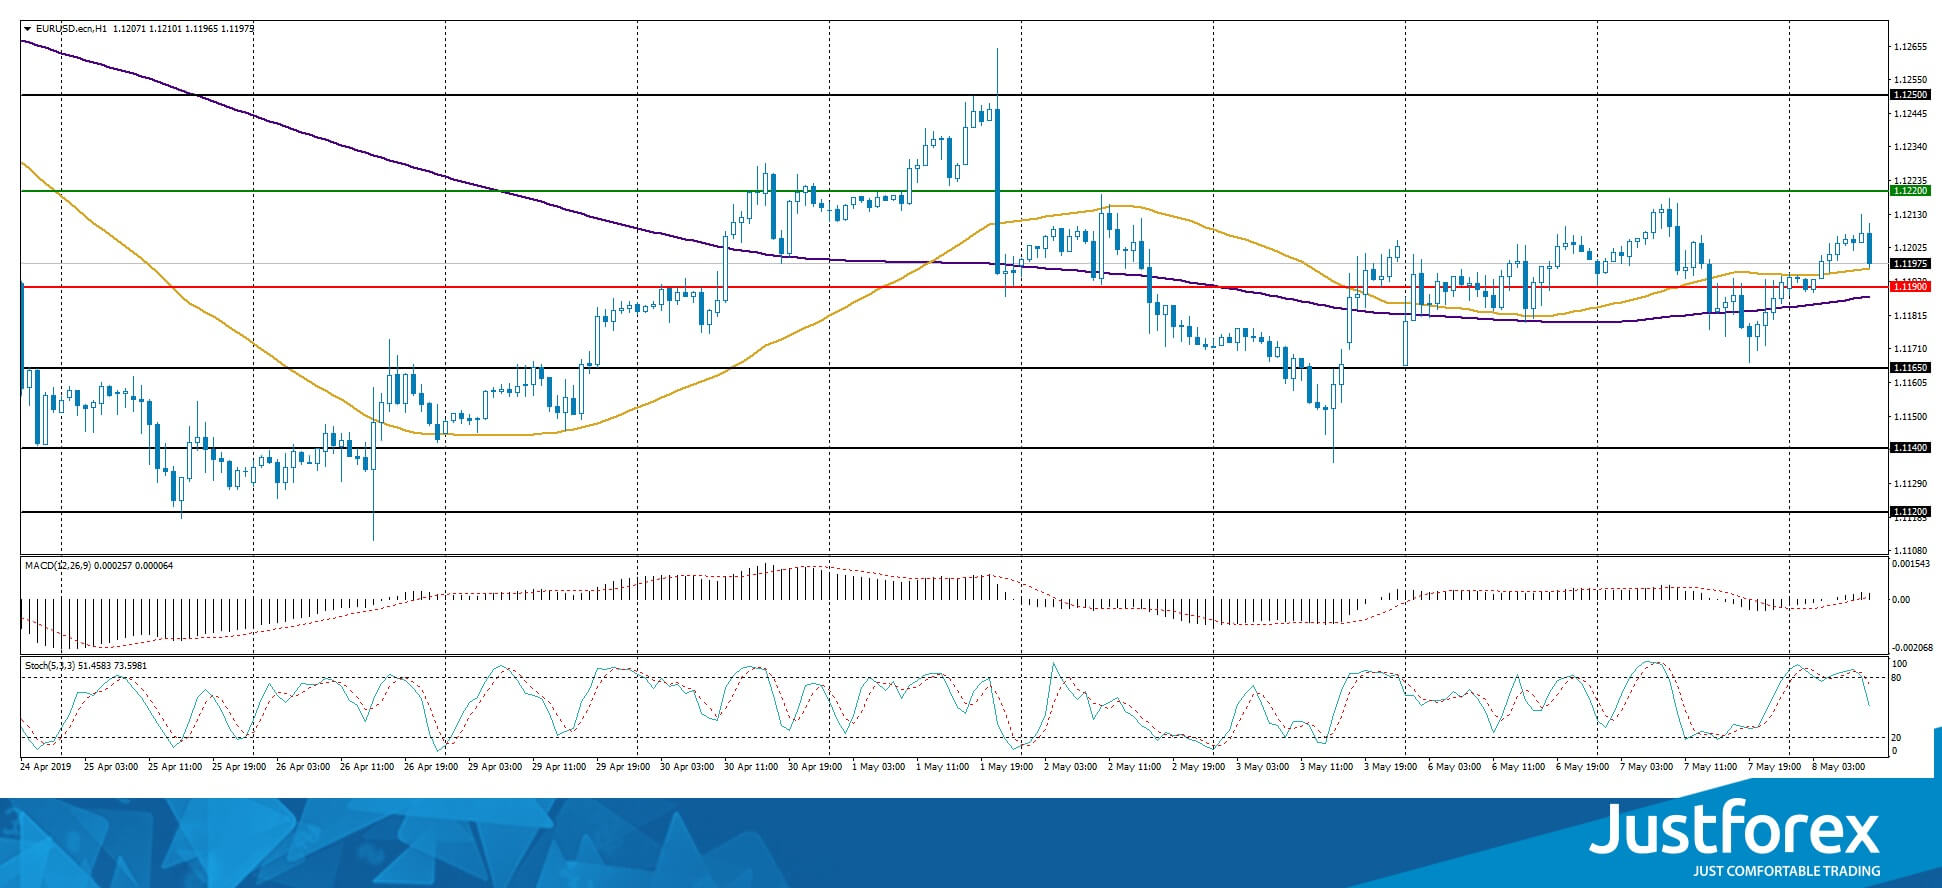
The indicators do not provide precise singals, 50 MA started to cross 200 MA.
The MACD histogram is in the positive zone but started to fall, which gives a weak signal to buy EUR/USD.
The Stochastic Oscillator started to leave the overbought zone, the %K line is below the %D line which points to a bearish mood.
Trading recommendations
Support levels: 1.11900, 1.11650, 1.11400
Resistance levels: 1.12200, 1.12500
If the price fixes above 1.12200, expect further growth toward 1.12500-1.12700.
Alternatively, the quotes can descend toward 1.11650-1.11500.
The GBP/USD currency pair
Technical indicators of the currency pair:
Prev Open: 1.30954
Open: 1.30645
% chg. over the last day: -0.23
Day’s range: 1.30386 – 1.30803
52 wk range: 1.2438 – 1.3631
The GBP/USD currency pair started to descend. The trading instrument has updated the local minimums. The GBP is under pressure due to the Brexit ambiguousness. The British press obtained information that the Parliament will pursue Theresa May’s resignation this week, should she accept a deal with the oppositions. Right now GBP/USD quotes are consolidating around 1.30400-1.30800. GBP can descend further, you should open positions from the key levels.
The Economic News Feed for 08.05.2019 is calm.
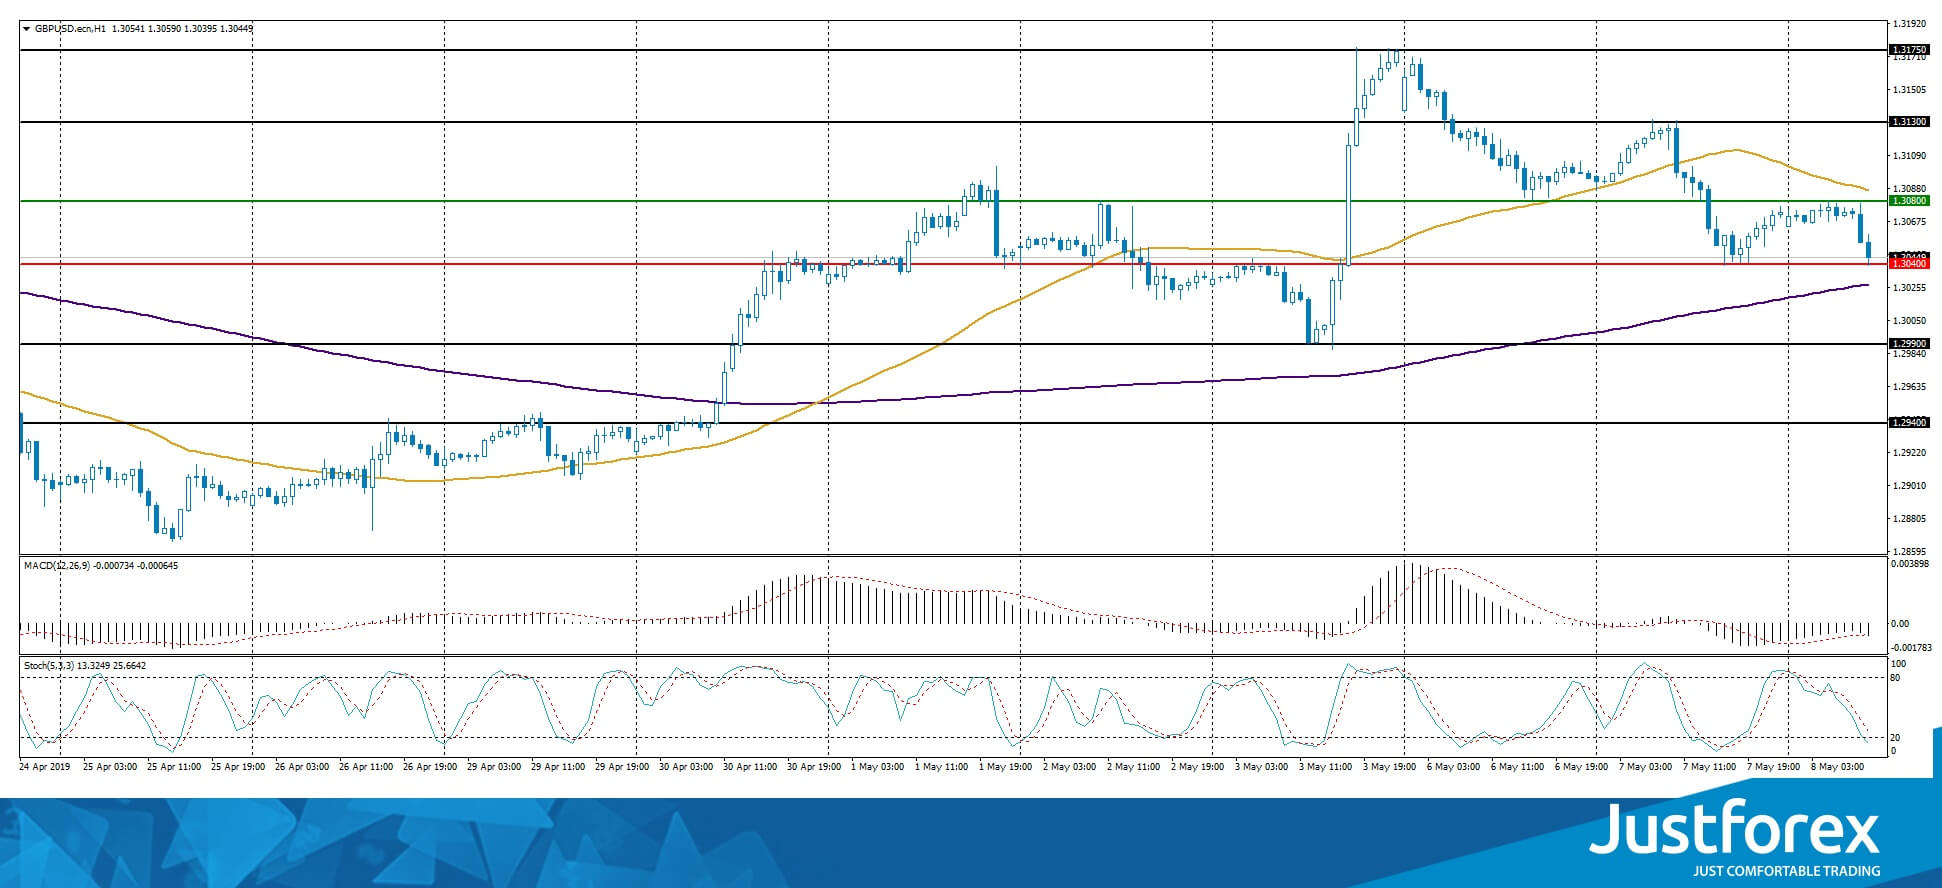
The indicators do not provide precise signals: the price fixed between 50 MA and 200 MA.
The MACD histogram is in the negative zone and keeps falling which gives a strong signal to sell GBP/USD.
The Stochastic Oscillator is in the neutral zone, the %K line is below the %D line which points toward a bearish mood.
Trading recommendations
Support levels: 1.30400, 1.29900, 1.29400
Resistance levels: 1.30800, 1.31300, 1.31750
If the price fixes below 1.30400, expect further descend toward 1.30000.
Alternatively, the qutoes can recover toward 1.31200-1.31500.
The USD/CAD currency pair
Technical indicators of the currency pair:
Prev Open: 1.34436
Open: 1.34646
% chg. over the last day: +0.16
Day’s range: 1.34538 – 1.34746
52 wk range: 1.2727 – 1.3664
Since the beginning of the year, USD/CAD has been in a very active trading. There are no defined trends. The local support and resistance levels are 1.34500-1.34750. The USD/CAD quotes started to descend. Keep an eye on the oil quotes dynamics and open positions from the key levels.
The Economic News Feed for 08.05.2019 is calm.
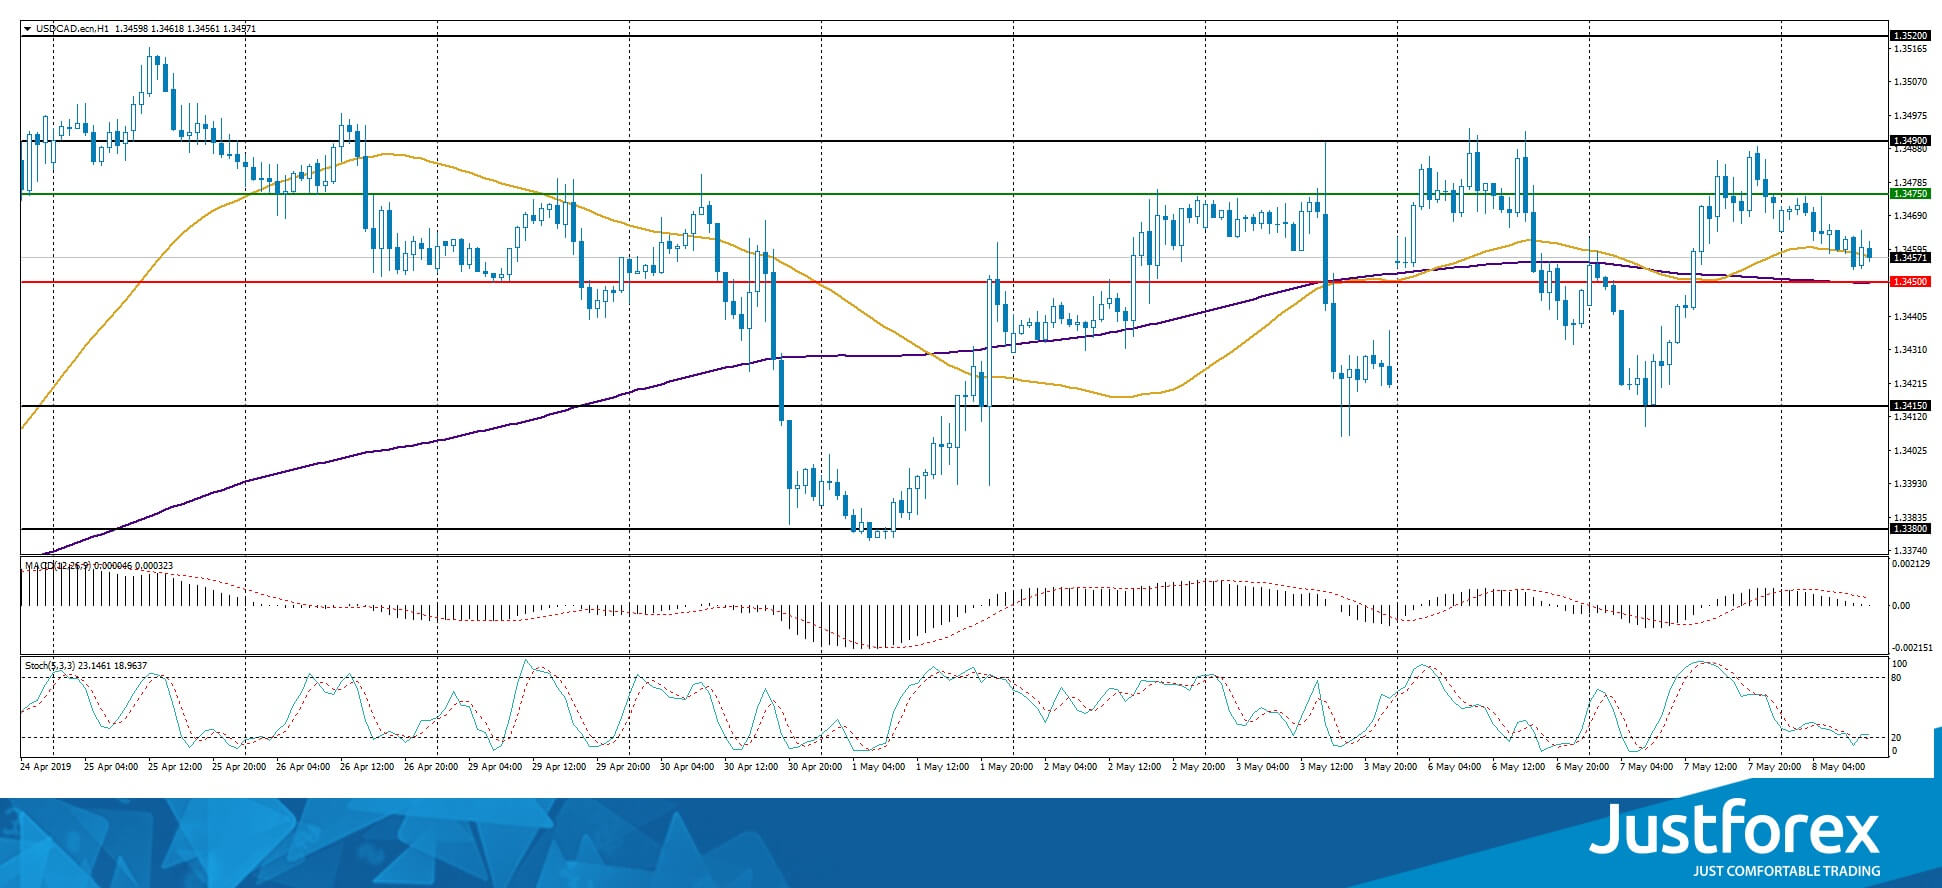
The indicators do not provide precise signals, the price has crossed 50 MA and 200 MA.
The MACD histogram is close to 0.
The Stochastic Oscillator is near the oversold zone, the %K line has crossed the %D line. There are no signals at the moment.
Trading recommendations
Support levels: 1.34500, 1.34150, 1.33800
Resistance levels: 1.34750, 1.34900, 1.35200
If the price fixes below 1.34500, consider selling USD/CAD. The movement will tend toward 1.34200-1.34000
Alternatively, the qutoes can grow toward 1.35000.
The USD/JPY currency pair
Technical indicators of the currency pair:
Prev Open: 110.713
Open: 110.228
% chg. over the last day: -0.46
Day’s range: 109.905 – 110.293
52 wk range: 104.97 – 114.56
USD/JPY is in the bearish mood. The trading instrument has updated the local minimums. The demand for safe assets remains high due the US/China trading conflict. Right now the quotes are consolidating between 109.900 and 110.300. The trading instrument can grow further. You should open positions from the key levels.
The Economic News Feed for 08.05.2019 is calm.
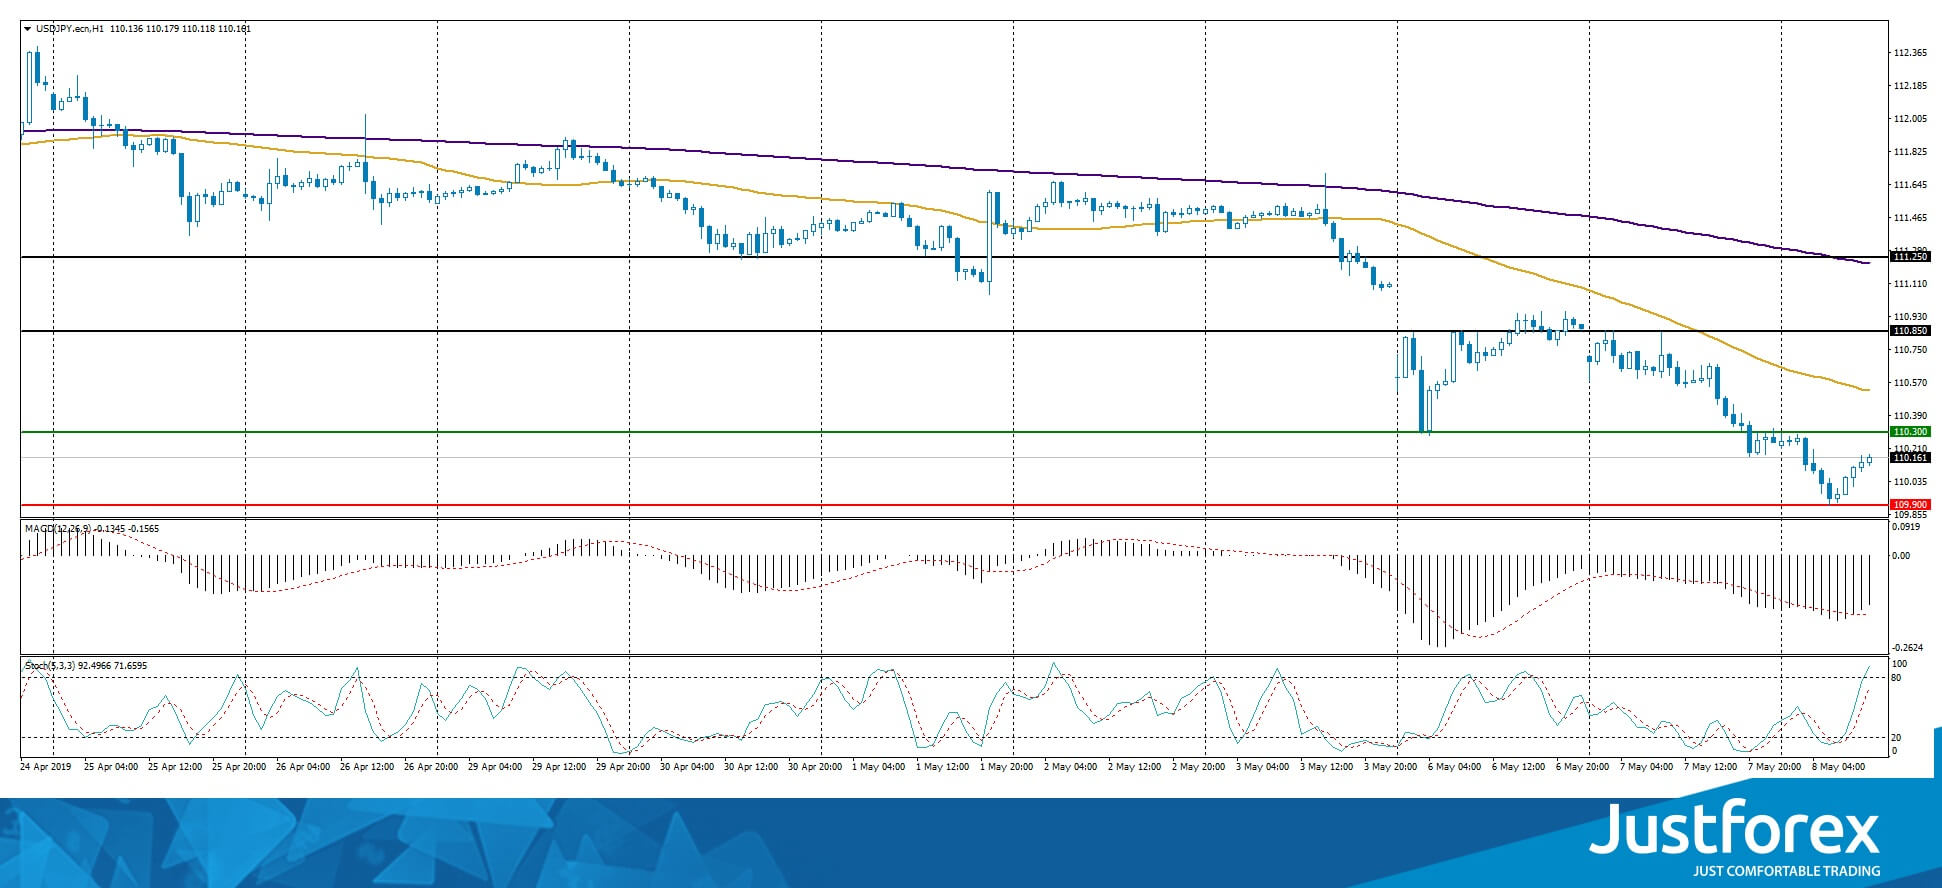
The price fixed below 50 MA and 200 MA which points toward the power of the buyers.
The MACD histogram is in the negative zone but above the signal line which gives a weak signal to sell USD/JPY.
The Stochastic Oscillator is in the neutral zone, the %K line is above the %D line which points toward a bullish mood.
Trading recommendations
Support levels: 109.900, 109.500
Resistance levels: 110.300, 110.850, 111.250
If the price fixes below the 109.900, expect the quotes to fall toward 109.500-109.300.
Alternatively, the quotes can recover toward 110.700-111.000.


