
The EUR/USD currency pair
Technical indicators of the currency pair:
Prev Open: 1.12213
Open: 1.12031
% chg. over the last day: -0.18
Day’s range: 1.11984 – 1.12134
52 wk range: 1.1111 – 1.2009
EUR/USD started to descend. The trading instrument updated the local minimums. EUR was under pressure yesterday due to the statements by the Italian vice-premier that the country is ready to violate the EU regulations regarding debt balance in order to increase the employment rates. Right now the quotes are consolidating around 1.12000-1.12200. The financial market participants are waiting for important releases from the US and the EU. The quotes can correct further. You should open positions from the key levels.
The Economic News Feed for 15.05.2019:
Preliminary GDP reports for the first quarter (EU) – 12:00 (GMT+3:00);
Retail sales report (US) – 15:30 (GMT+3:00);
Industrial production volume (US) – 00:00 (GMT+3:00);
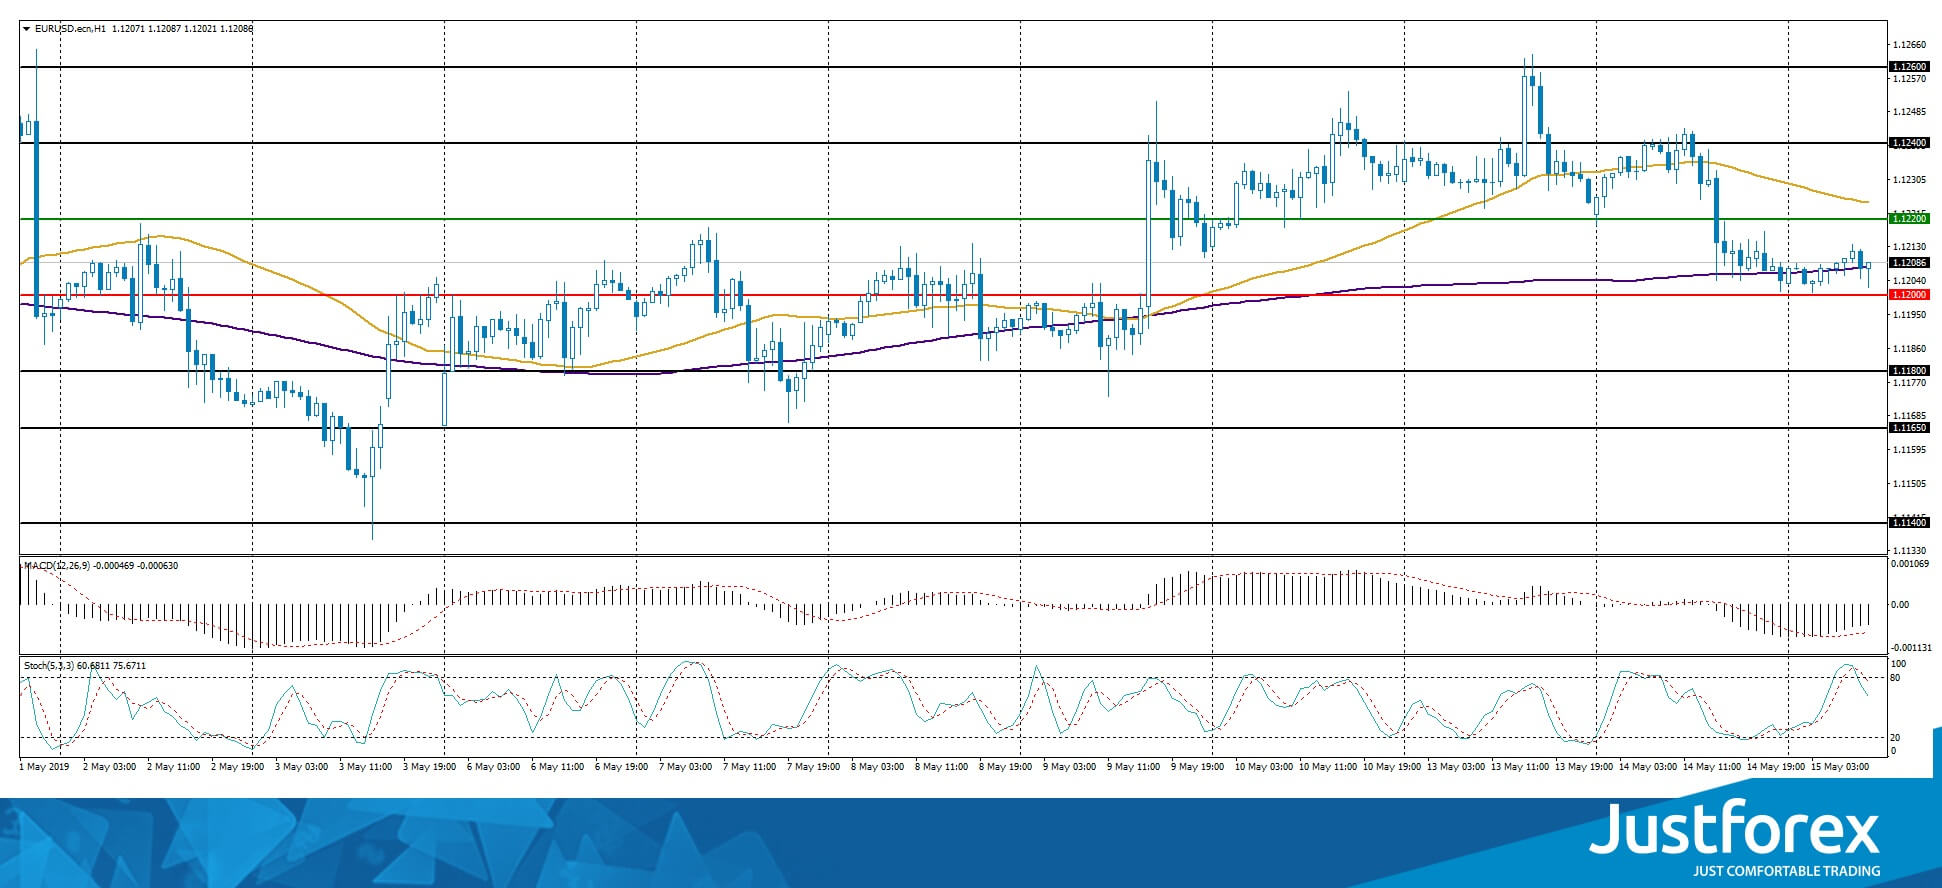
The indicators do not provide precise signals, the price has crossed 200 MA.
The MACD histogram is in the neutral zone but above the signal line which gives a weak signal to sell EUR/USD.
The Stochastic Oscillator is in the neutral zone, the %K line is below the %D line which points to the bearish mood.
Trading recommendations
Support levels: 1.12000, 1.11800, 1.11650
Resistance levels: 1.12200, 1.12400, 1.12600
If the price fixes below 1.12000, consider further descend 1.11800-1.11600.
Alternatively, the quotes can recover toward 1.12400-1.12600.
The GBP/USD currency pair
Technical indicators of the currency pair:
Prev Open: 1.29547
Open: 1.29035
% chg. over the last day: -0.38
Day’s range: 1.28988 – 1.29181
52 wk range: 1.2438 – 1.3631
GBP kept losing positions against USD. The quotes fell by more than 50 points. The GBP is under pressure due to the weak labout market report in the UK. Right now GBP/USD is consolidating around 1.29000. 1.29350 acts as a mirror resistance. The trading instrument can descend lower. You should open positions from the key levels.
The Economic News Feed for 15.05.2019 is calm.
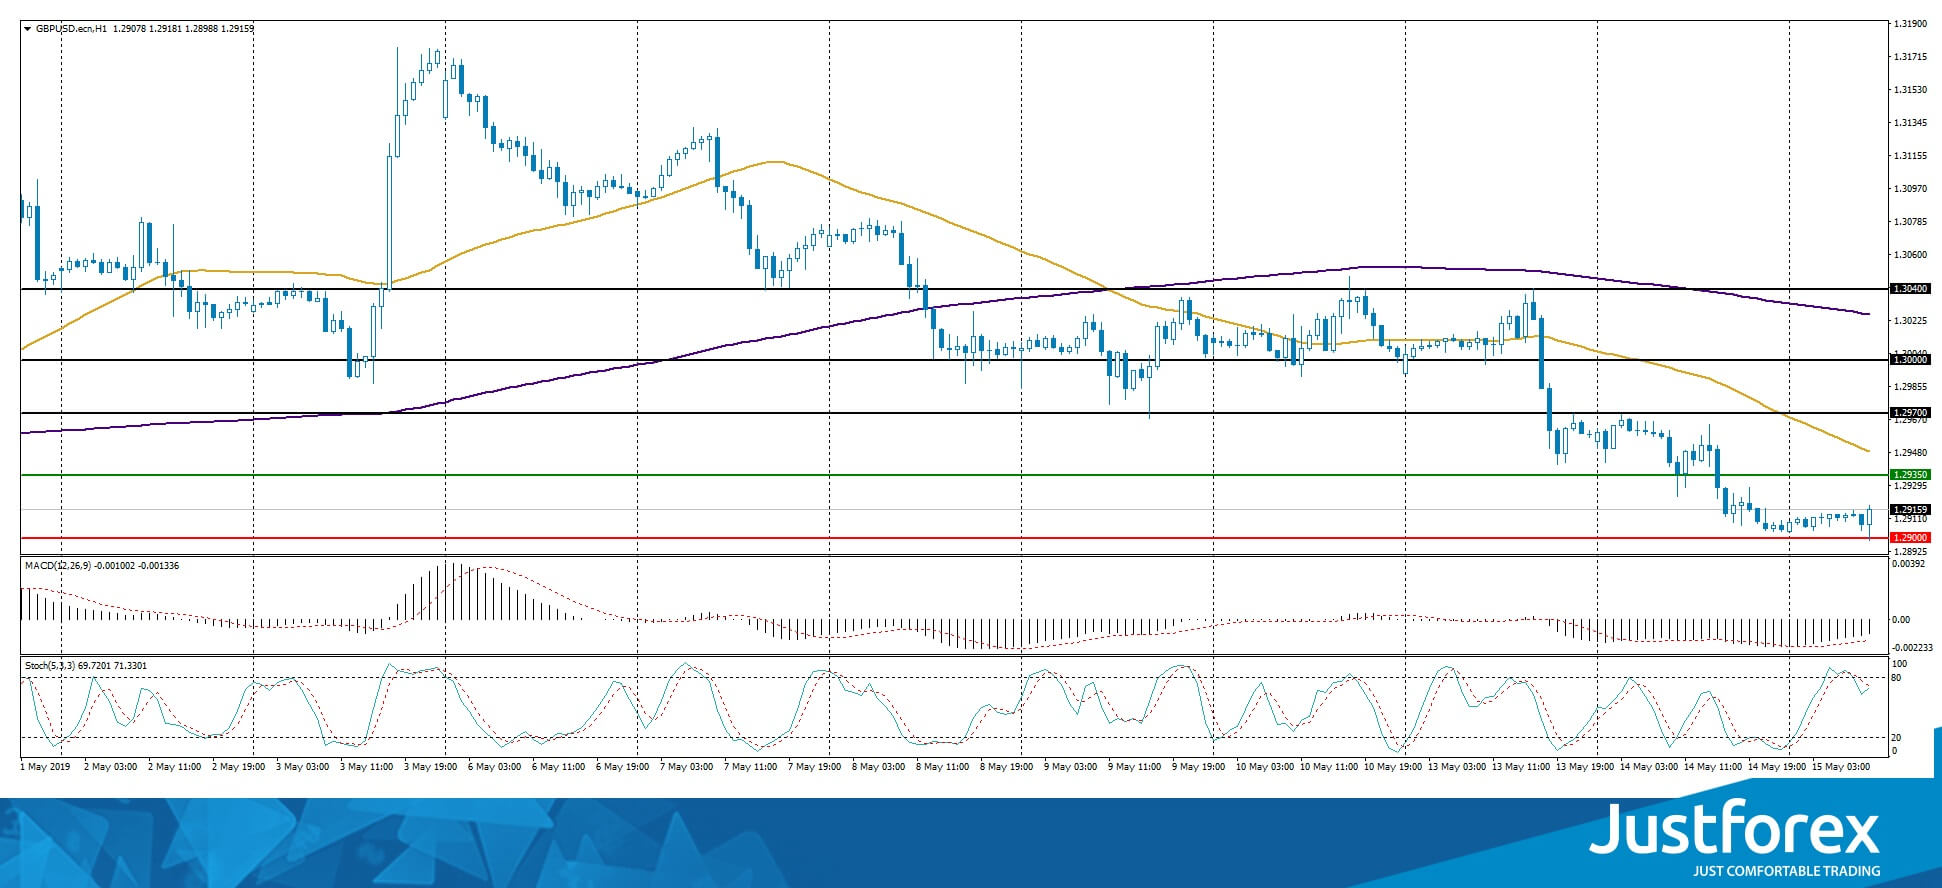
The price fixed below 50 MA and 200 MA which points to the power of the buyes.
The MACD histogram is in the negative zone but above the signal line which gives a weak signal to sell GBP/USD.
The Stochastic Oscillator is in the neutral zone, the %K line started to cross the %D line. There are no signals at the moment.
Trading recommendations
Support levels: 1.29000, 1.28500
Resistance levels: 1.29350, 1.29700, 1.30000
If the price fixes below 1.29000, expect further descend toward 1.28600-1.28400.
Alternatively, the quotes can recover toward 1.29700-1.30000.
The USD/CAD currency pair
Technical indicators of the currency pair:
Prev Open: 1.34716
Open: 1.34629
% chg. over the last day: -0.12
Day’s range: 1.34563 – 1.34772
52 wk range: 1.2727 – 1.3664
USD/CAD has an ambigous technical picture. The instrument is moving sideways. The local support and resistance are 1.34550 and 1.34850. The investors are waiting for the Canadian inflation report. Keep an eye on the oil quotes and open positions from the key levels.
At 15:30 (GMT+3:00) Canada will publish a consumer price index.
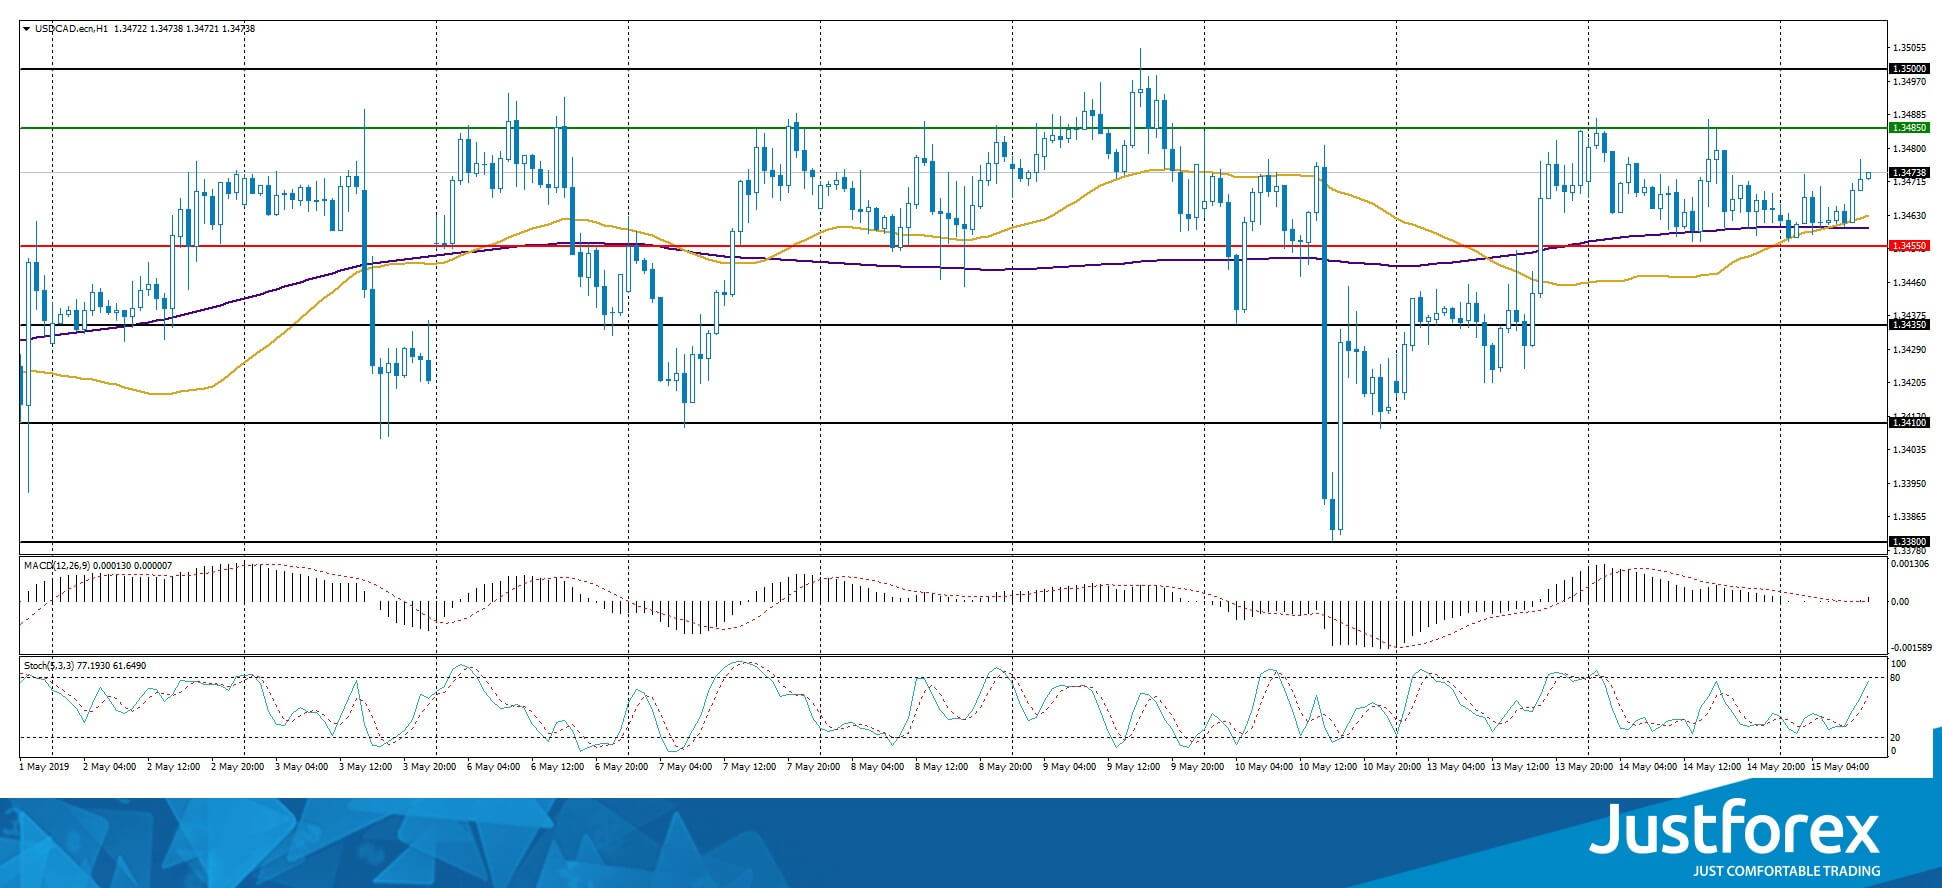
The indicators do not provide precise singals, 50 MA has crossed 200 MA.
The MACD histogram is close to 0. There are no precise signals.
The Stochastic Oscillator is in the neutral zone, the %K line is above the %D line which points to the bullish mood.
Trading recommendations
Support levels: 1.34550, 1.34350, 1.34100
Resistance levels: 1.34850, 1.35000
If the price fixes above 1.34850, expect further growth toward 1.35250-1.35400.
Alternatively, the quotes can descend toward 1.34300-1.34100.
The USD/JPY currency pair
Technical indicators of the currency pair:
Prev Open: 109.287
Open: 109.620
% chg. over the last day: +0.33
Day’s range: 109.485 – 109.702
52 wk range: 104.97 – 114.56
USD/JPY is consolidating around 109.350-109.750. There is no defined trend. The quotes have prospects for recovery after a long fall. The investors are waiting for more info regarding the US/China negotiations. Keep an eye on the US news feed and open positions from the key levels.
The Economic News Feed for 15.05.2019 is calm.
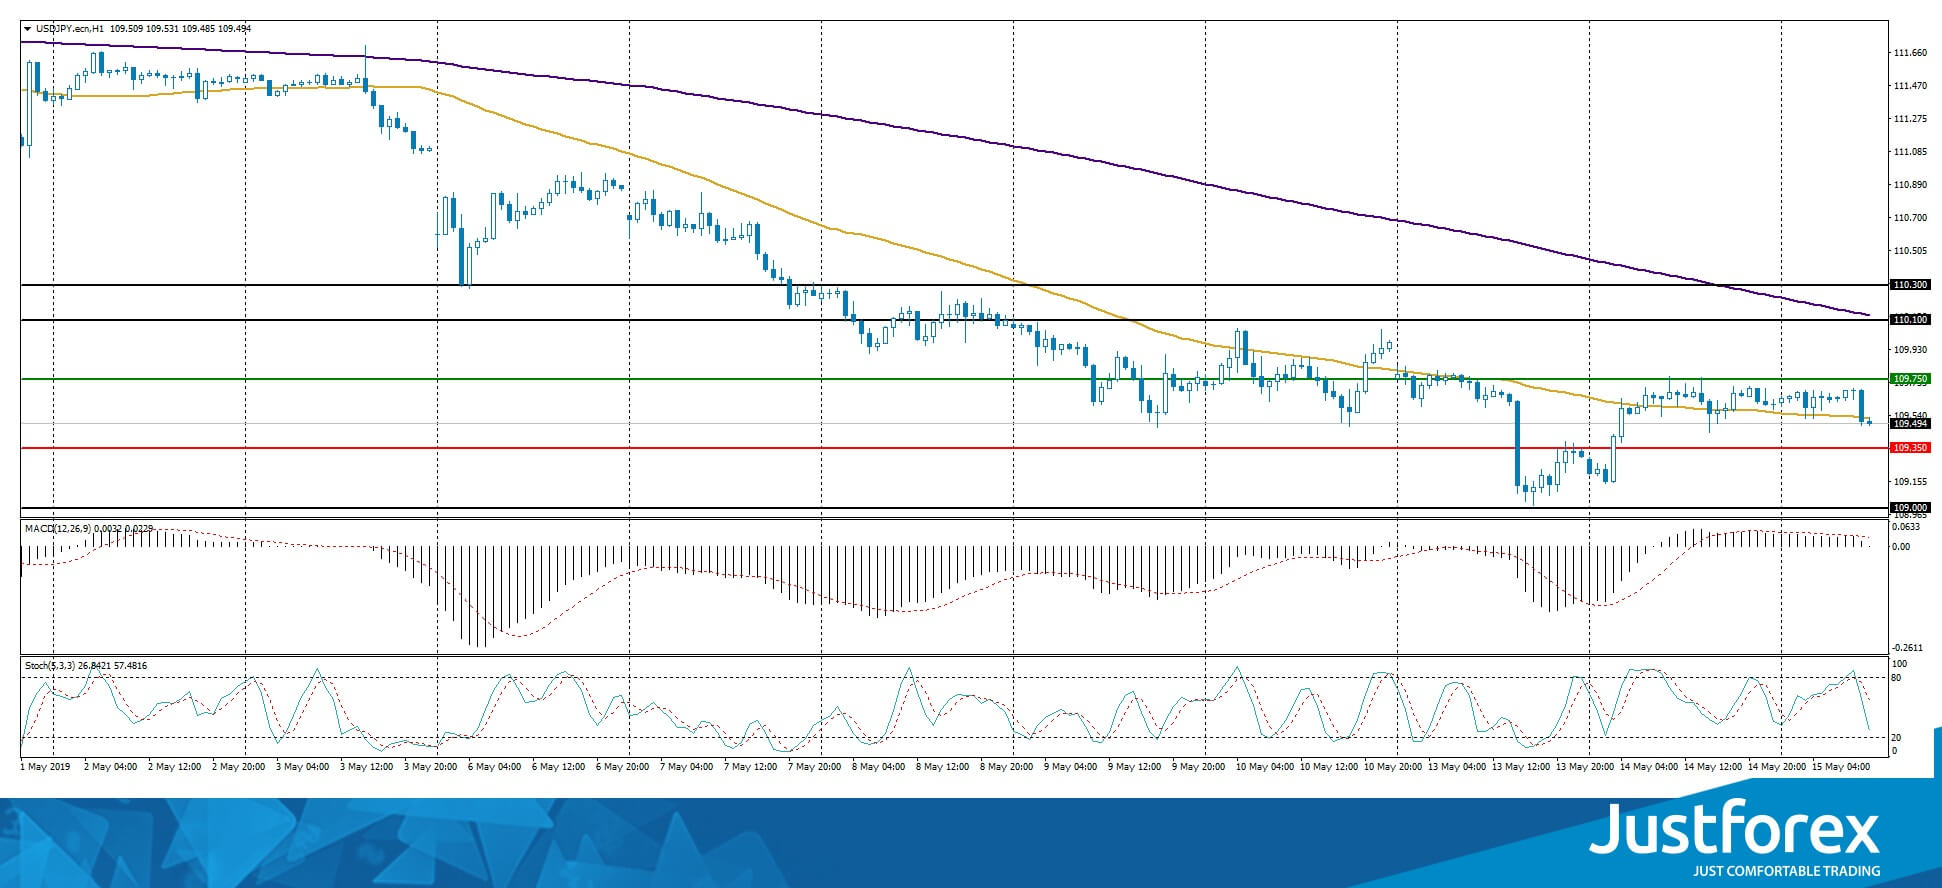
The indicators do not provide signals, the price crossed 50 MA.
The MACD histogram is close to 0. There are no signals.
The Stochastic Oscillator is in the neutral zone, the %K line is below the %D line which points towards selling USD/JPY.
Trading recommendations
Support levels: 109.350, 109.000
Resistance levels: 109.750, 110.100, 110.300
If the price fixes above 109.750, expect further correction toward 110.100-110.300.
Alternatively, the qutoes can fall toward 109.000.


