
The EUR/USD currency pair
Technical indicators of the currency pair:
Prev Open: 1.11602
Open: 1.11650
% chg. over the last day: +0.05
Day’s range: 1.11443 – 1.11722
52 wk range: 1.1111 – 1.2009
EUR/USD remains in a bullish mood. Right now EUR is consolidating around 1.11450-1.11650. The market participants keep watching the Washington/Beijing trading conflict. Threats of further actions escalated after the US sanctioned Chinese tech giant Huawei. Further descend of the quotes remain possible. You should open positions from the key levels.
At 17:00 (GMT+3:00) the US will publish the secondary real estate sales report.
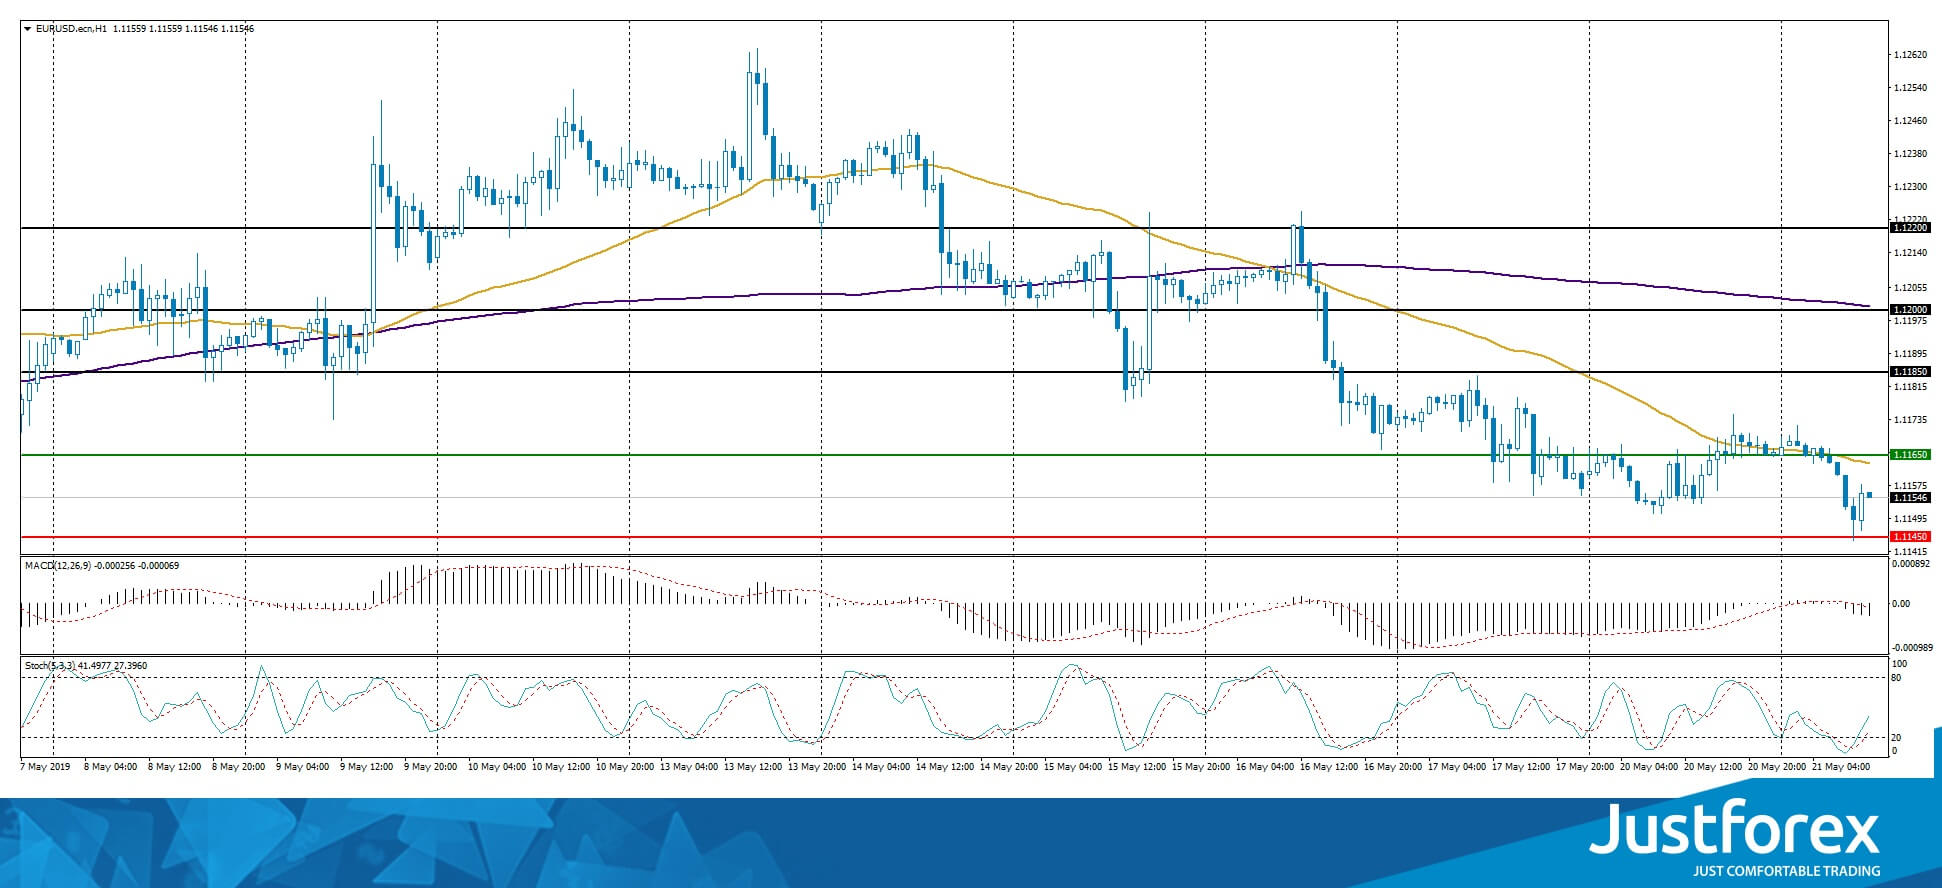
The price fixed below 50 MA and 200 MA which points towards the power of the sellers.
The MACD histogram is in the negative zone and below the signal line which gives a strong signal towards selling EUR/USD.
The Stochastic Oscillator is in the neutral zone, the %K line is above the %D line which points towards a bullish mood.
Trading recommendations
Support levels: 1.11450, 1.11200, 1.11000
Resistance levels: 1.11650, 1.11850, 1.12000
If the price fixes below 1.11450, expect further descend toward 1.11200-1.11000.
Alternatively, the quotes can recover toward 1.11800-1.12000.
The GBP/USD currency pair
Technical indicators of the currency pair:
Prev Open: 1.27303
Open: 1.27210
% chg. over the last day: -0.02
Day’s range: 1.26853 – 1.27322
52 wk range: 1.2438 – 1.3631
GBP/USD keeps showing a negative trend. The ambiguousness regarding Brexit pushed the GBP down. Theresa May earlier stated that she wants to present a brave new offer to the lawmakers in order to reach the Brexit agreement. The local support and resistance levels are 1.26800 and 1.27150. The trading instrument can descend further. You should open positions from the key levels.
At 11:30 (GMT+3:00) the Bank of England will publish the inflation report.
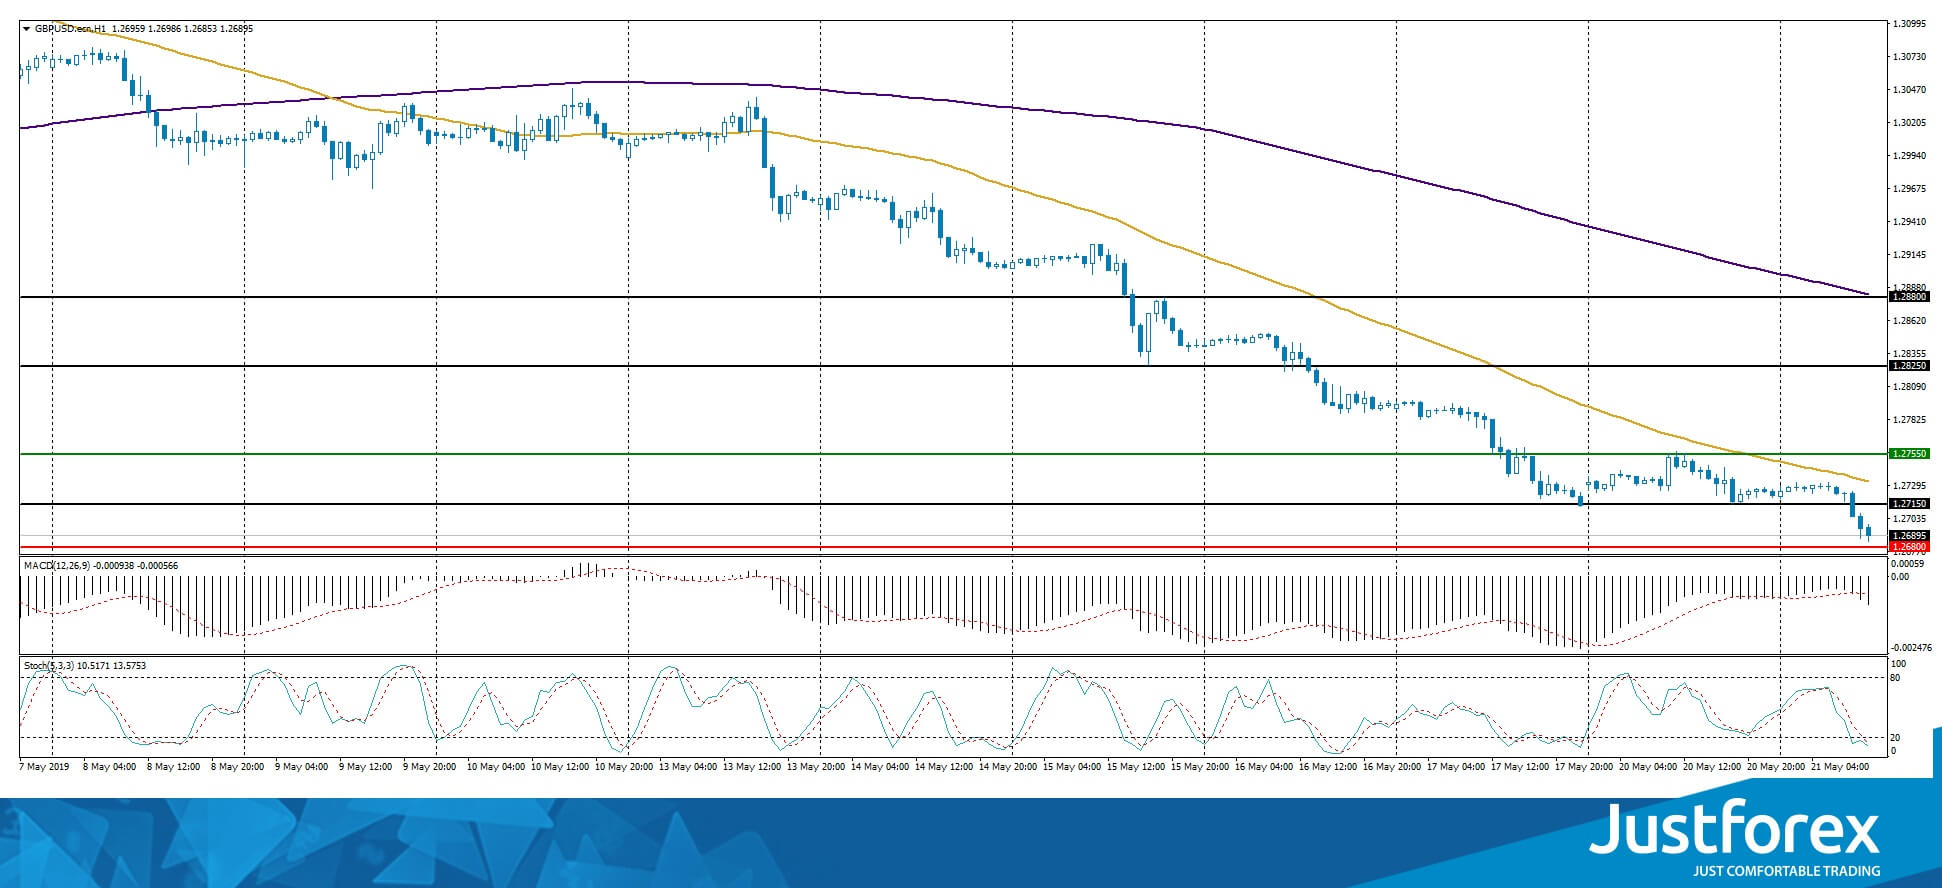
The price fixed below 50 MA and 200 MA which points to the power of the sellers.
The MACD histogram is in the negative zone and below the signal line which indicates a signal to sell GBP/USD.
The Stochastic Oscillator is in the oversold zone, the %K line is below the %D line which gives a weak signal to sell GBP/USD.
Trading recommendations
Support levels: 1.26800, 1.26500
Resistance levels: 1.27150, 1.27550, 1.28250
If the price fixes below the 1.26800, expect further descend toward 1.26500-1.26300.
Alternatively, the quotes can recover toward the round 1.28000.
The USD/CAD currency pair
Technical indicators of the currency pair:
Prev Open: 1.34399
Open: 1.34246
% chg. over the last day: -0.14
Day’s range: 1.34194 – 1.34355
52 wk range: 1.2727 – 1.3664
USD/CAD keeps showing an ambiguous technical picture. The trading instrument is consolidating. The local support and resistance levels are 1.34200 and 1.34450. The financial market participants are waiting for additional drivers. Keep an eye on the oil quotes and open positions from the key levels.
The Economic News Feed for 21.05.2019 is calm.
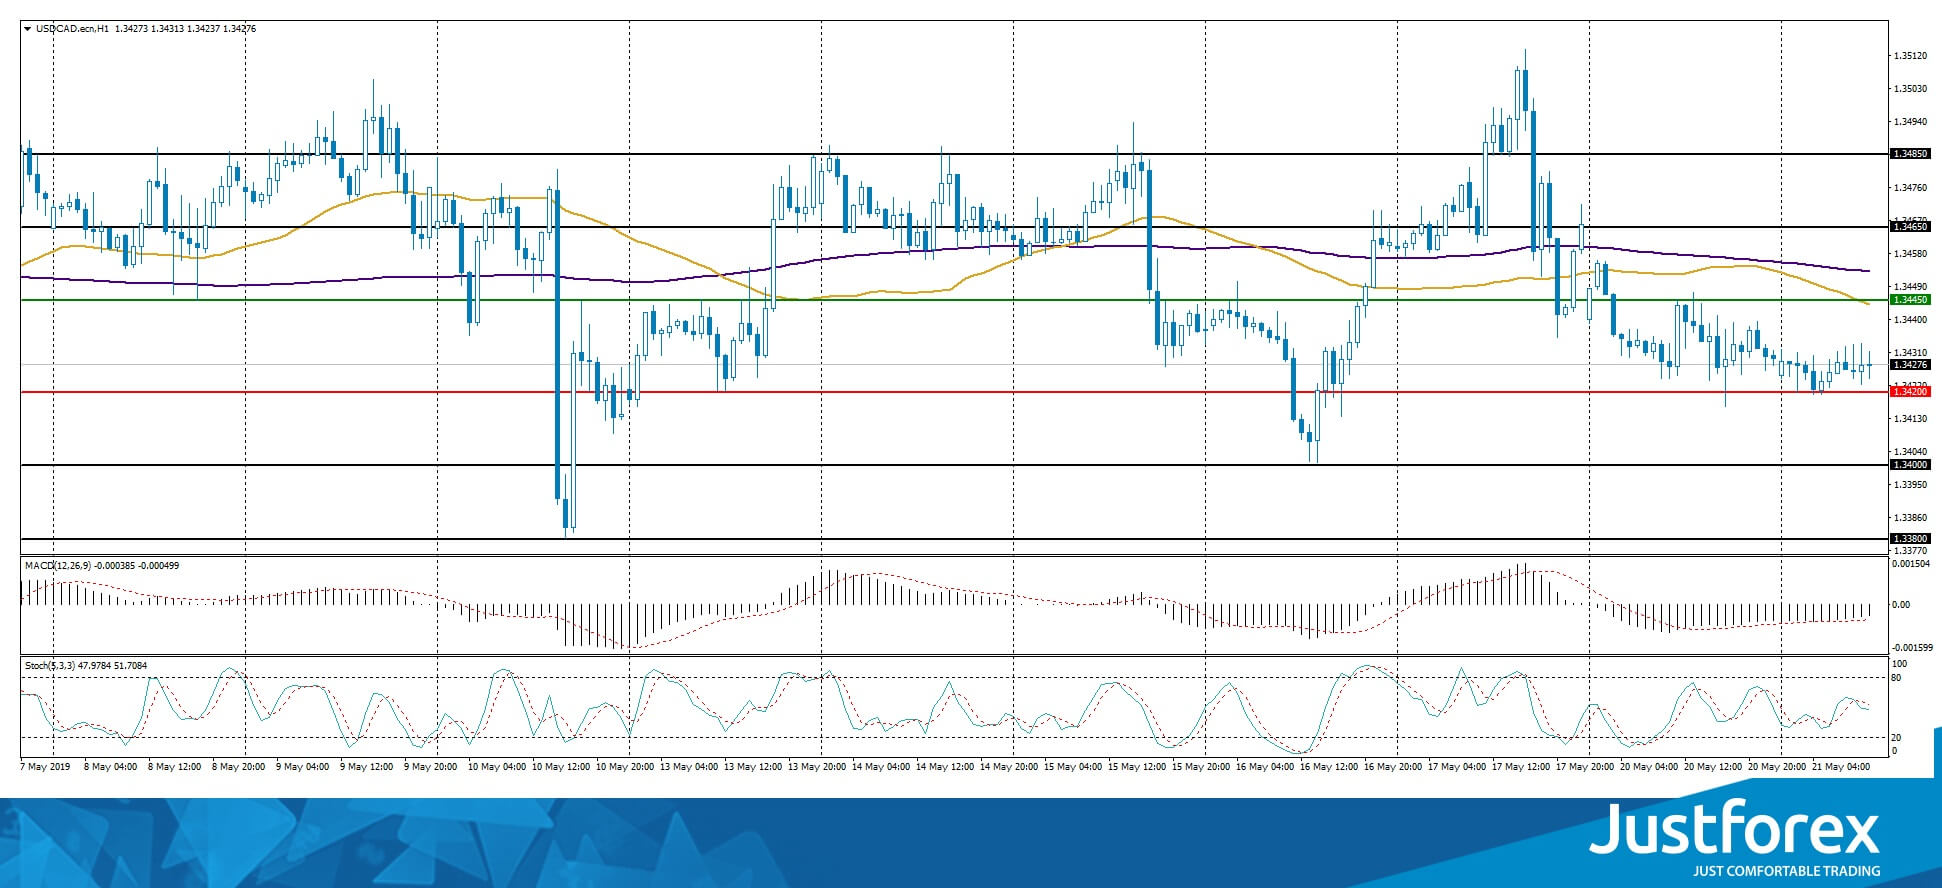
The price fixed below 200 MA which points towards the power of the sellers.
The MACD histogram is in the negative zone but above the signal line which gives a weak signal to sell USD/CAD.
The Stochastic Oscillator is in the neutral zone, the %K line started to cross the %D line. There are no signals at the moment.
Trading recommendations
Support levels: 1.34200, 1.34000, 1.33800
Resistance levels: 1.34450, 1.34650, 1.34850
If the price fixes below 1.34200, expect further descend towards 1.34000-1.33800.
Alternatively, the quotes can grow towards 1.34700-1.34850.
The USD/JPY currency pair
Technical indicators of the currency pair:
Prev Open: 110.103
Open: 110.068
% chg. over the last day: -0.07
Day’s range: 110.010 – 110.263
52 wk range: 104.97 – 114.56
USD/JPY stabilized. The technical picture is ambiguous. The local support and resistance are 110.000 and 110.300. The demand for the safe assets remains due to the US/China trading conflict. The trading instrument can descend further.
The Economic News Feed for 21.05.2019 is calm.
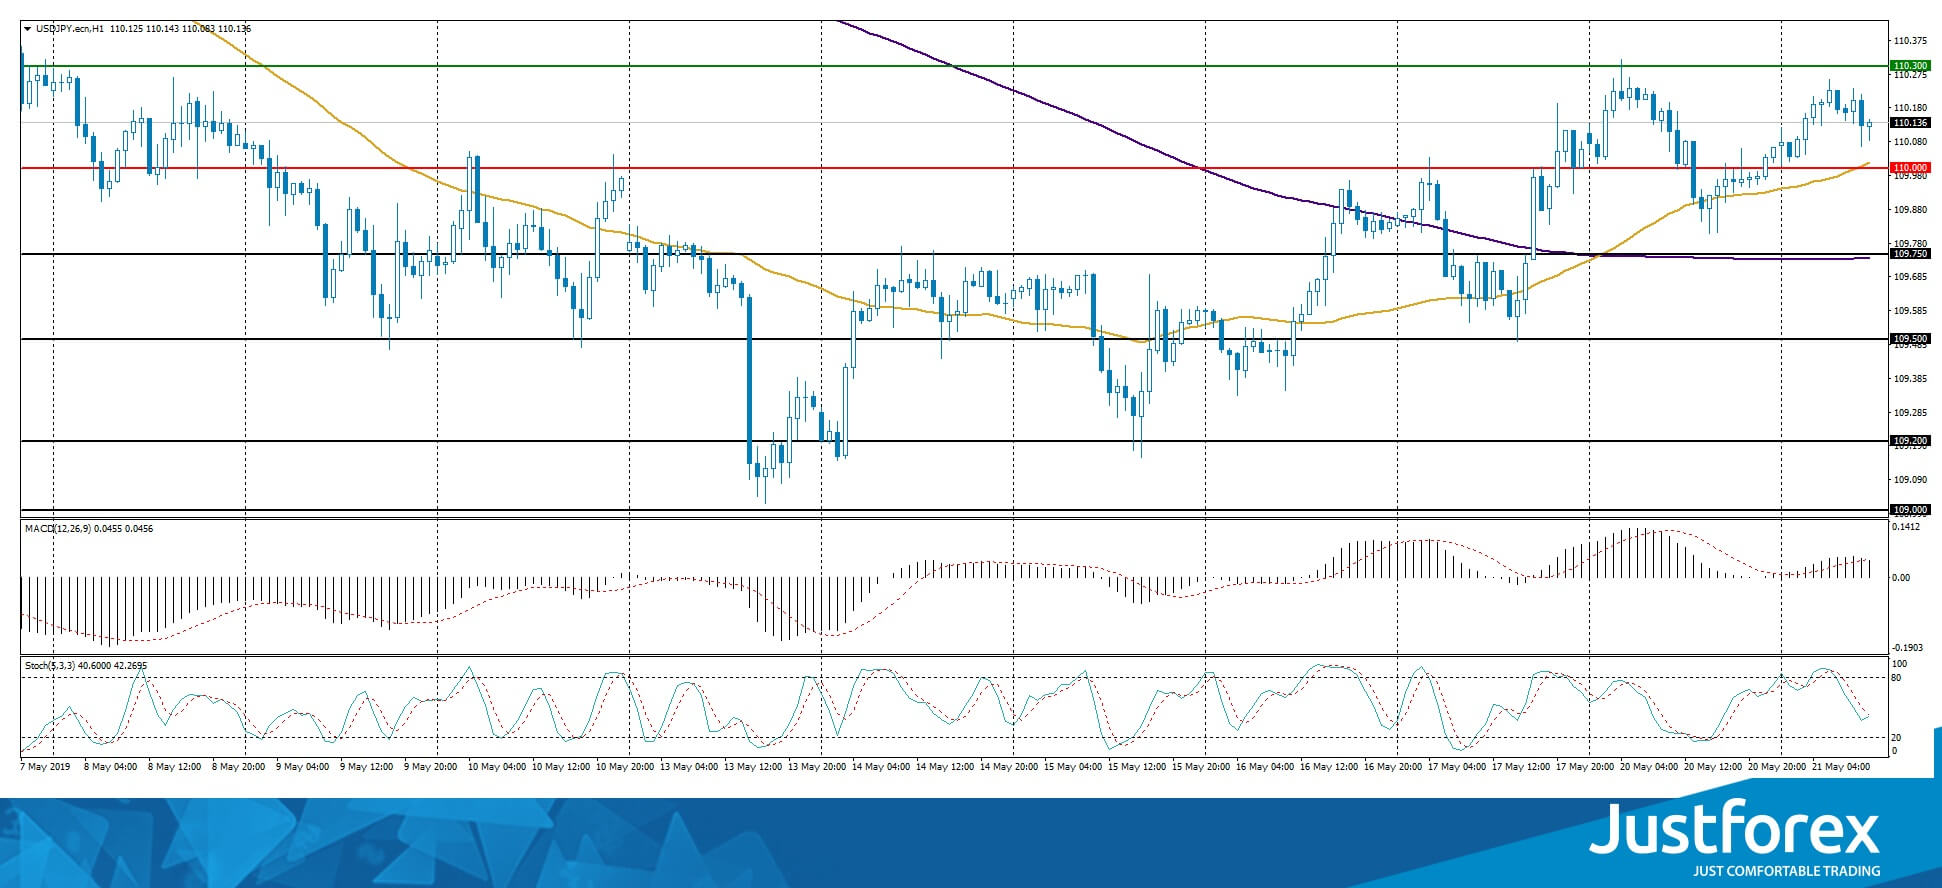
The price fixed above 50 MA and 200 MA which points towads the power of the buyers.
The MACD histogram is in the positive zone but below the signal line which gives a weak signal towards buying USD/JPY.
The Stochastic Oscillator is in the neutral zone, the %K line is crossing the %D line. There are no signals at the moment.
Trading recommendations
Support levels: 110.000, 109.750, 109.500
Resistance levels: 110.300, 110.700
If the price fixes below the round 110.000, expect further descend towards 109.750-109.500.
Alternatively, the quotes can grow towards 110.600-110.800.


