
The EUR/USD currency pair
Technical indicators of the currency pair:
Prev Open: 1.11650
Open: 1.11568
% chg. over the last day: -0.06
Day’s range: 1.11494 – 1.11660
52 wk range: 1.1111 – 1.2009
EUR/USD stabilized after a long fall. The trading instrument is consolidating. The market participants are waiting for the FOMC minutes. Keep an eye on the rhetorics of the Central Bank officials, especially since Jerome Powerll mentionted that they aren’t going to force the key interest rates’ change. Right now the key levels are at 1.11450 and 1.11650. You should open positions from the key levels.
At 21:00 (GMT+3:00) the US will publish the FOMC Minutes.
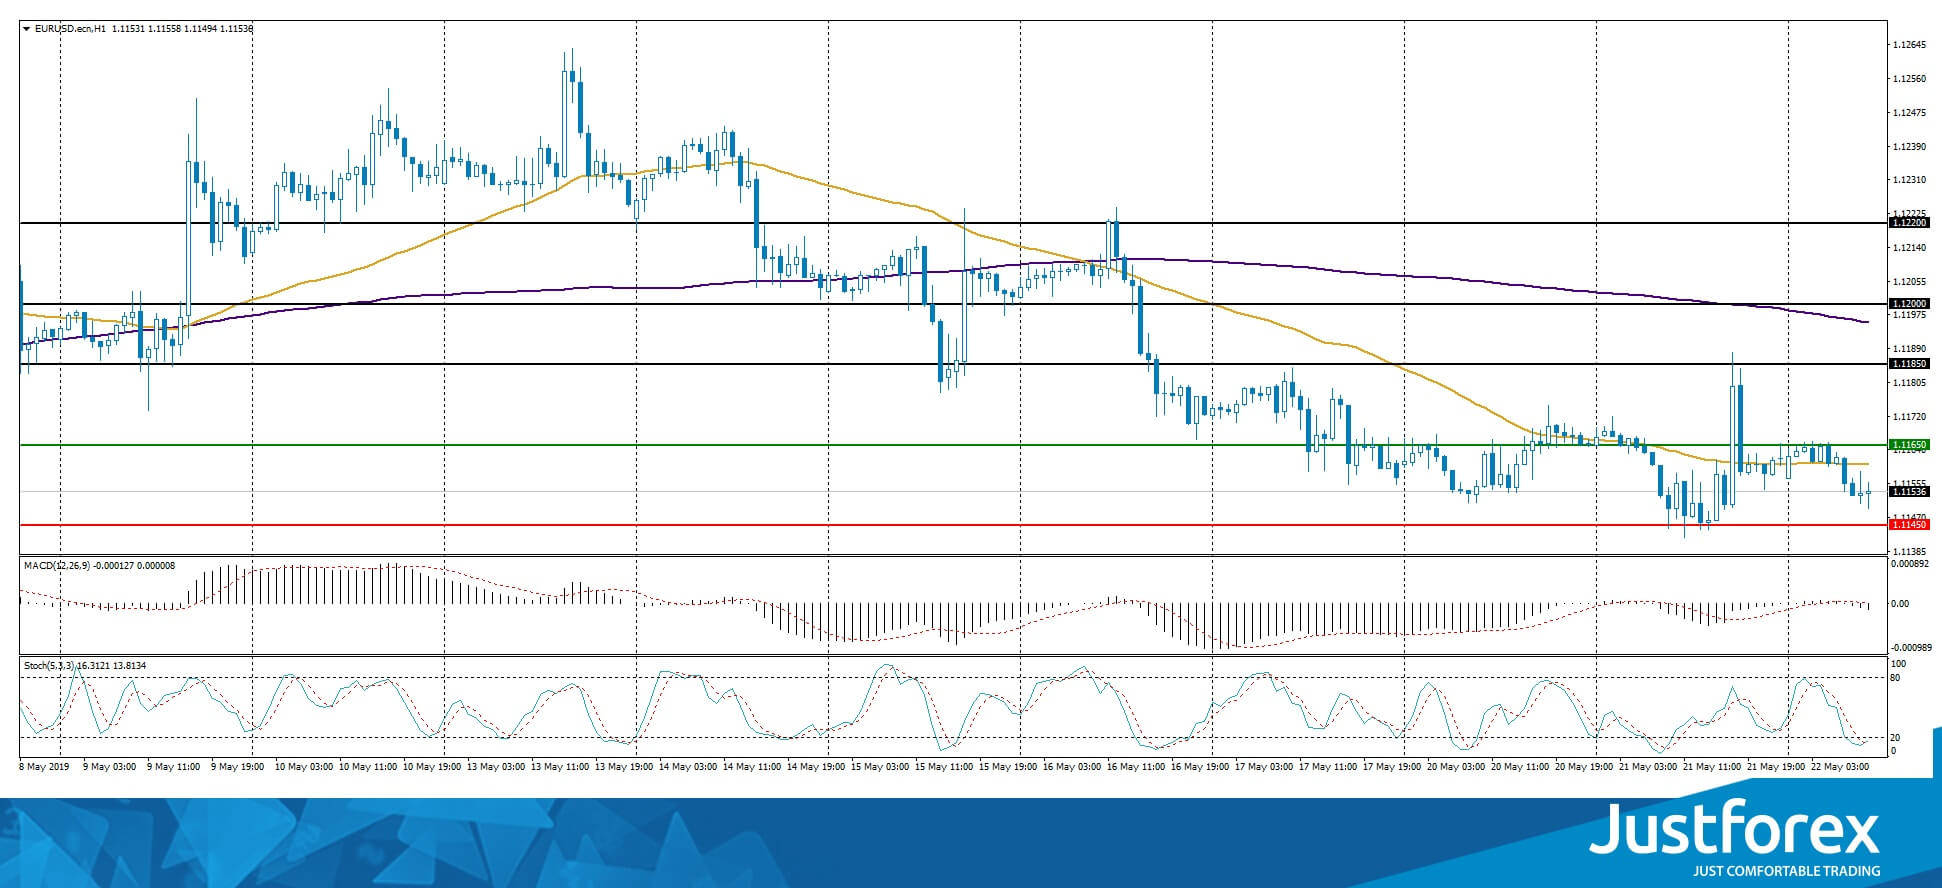
The indicators do not provide precise signals, the price has crossed 50 MA.
The MACD histogram started to descend which points towards further fall of the EUR/USD quotes.
The Stochastic Oscillator is in the neutral zone, the %K line is crossing the %D line. There are no signals at the moment.
Trading recommendations
Support levels: 1.11450, 1.11200, 1.11000
Resistance levels: 1.11650, 1.11850, 1.12000
If the price fixes below 1.11450, expect further descend towards the round 1.11000.
Alternatively, the quotes can correct towards 1.11850-1.12000.
The GBP/USD currency pair
Technical indicators of the currency pair:
Prev Open: 1.27210
Open: 1.27047
% chg. over the last day: -0.15
Day’s range: 1.26617 – 1.27193
52 wk range: 1.2438 – 1.3631
GBP/USD remains in the bearish mood. The trading instrument updated the local minimums. Theresa May is not sure she can convince the lawmakers to accept the updated Brexit agreement. The quotes are testing the support at 1.26600 with the mirror resistance being at 1.27100. They can descend further.
At 11:30 (GMT+3:00) the UK will publish an inflation report.
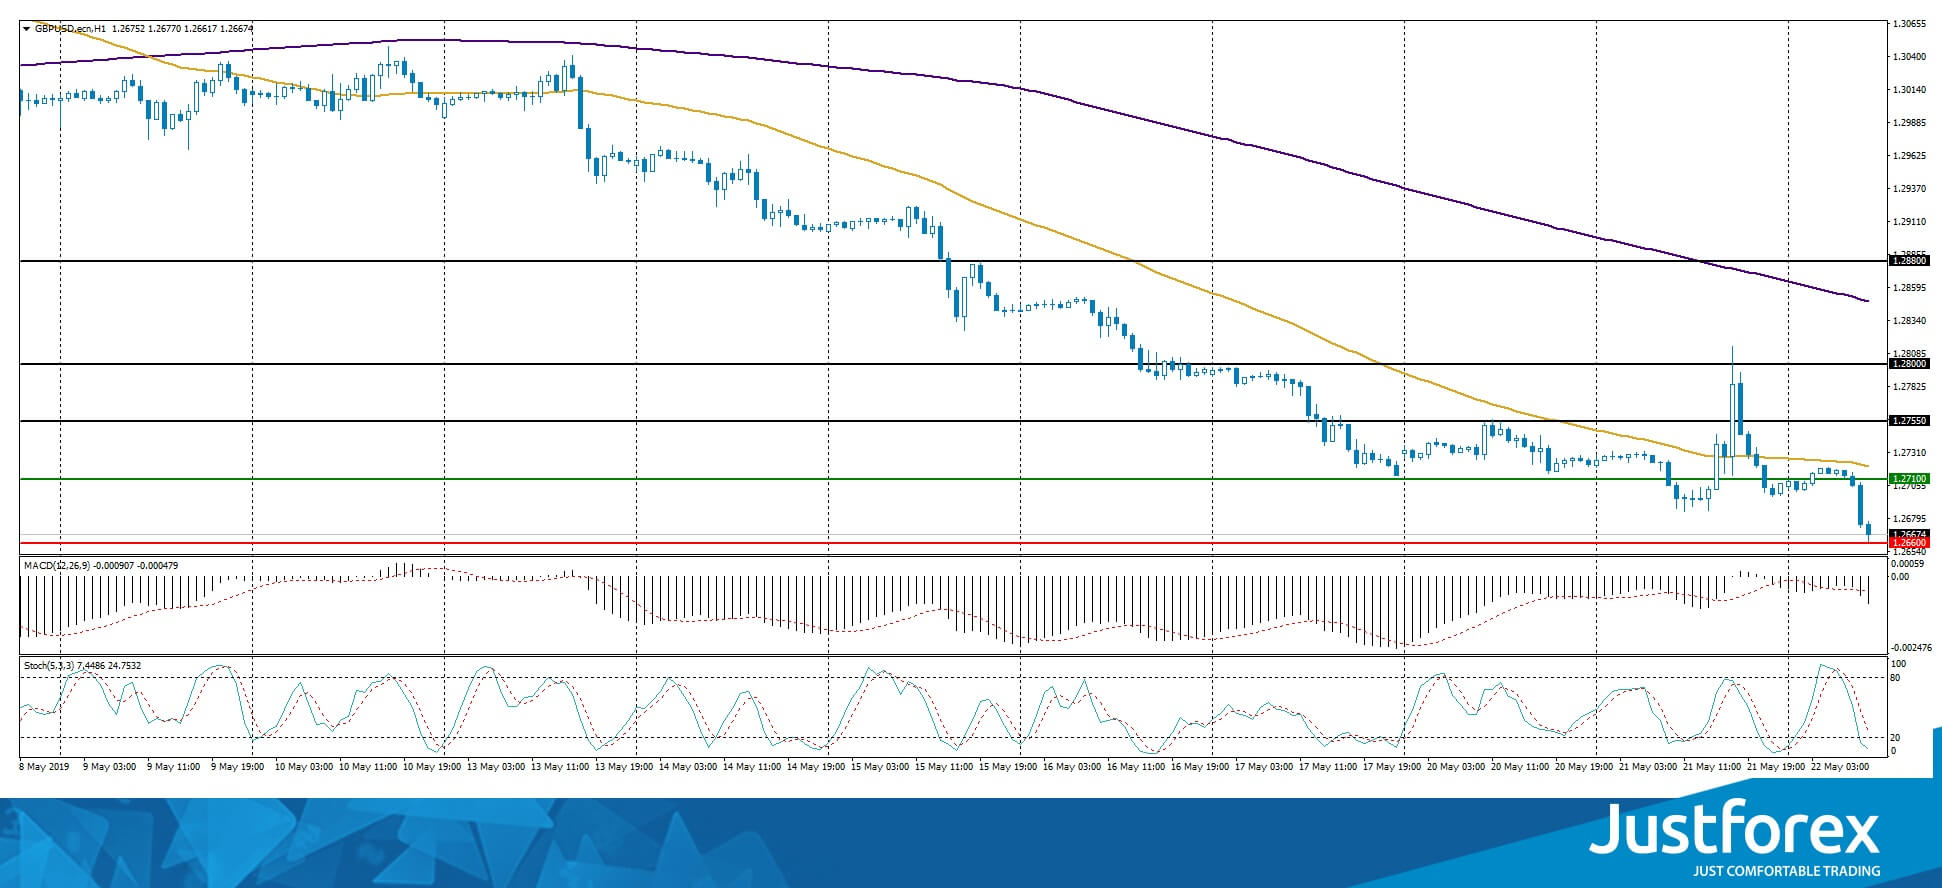
The price fixed below 50 MA and 200 MA which points towards the power of the sellers.
The MACD histogram is in the negative zone and below the signal line which gives a strong singal to sell GBP/USD.
The Stochastic Oscillator is in the neutral zone, the %K line is below the %D line which points toward a bearish mood.
Trading recommendations
Support levels: 1.26600, 1.26200, 1.26000
Resistance levels: 1.27100, 1.27550, 1.28000
If the price fixes below 1.26600, expect further descend towards 1.26300-1.26000.
Alternatively, the quotes can recover towards 1.27500-1.27800.
The USD/CAD currency pair
Technical indicators of the currency pair:
Prev Open: 1.34246
Open: 1.34018
% chg. over the last day: -0.18
Day’s range: 1.33947 – 1.34165
52 wk range: 1.2727 – 1.3664
USD/CAD remains ambiguous. The trading instrument keeps consolidating. The local support and resistance levels are 1.34000 and 1.34250. The investors are waiting for reports from the US and Canada, as well as the oil quotes dynamics. You should open positions from the key levels.
At 15:30 (GMT+3:00) Canada will publish the retail sales report.
Economic Event (CAD) – 00:00 (GMT+3:00);
Economic Event (CAD) – 00:00 (GMT+3:00);
Economic Event (CAD) – 00:00 (GMT+3:00)
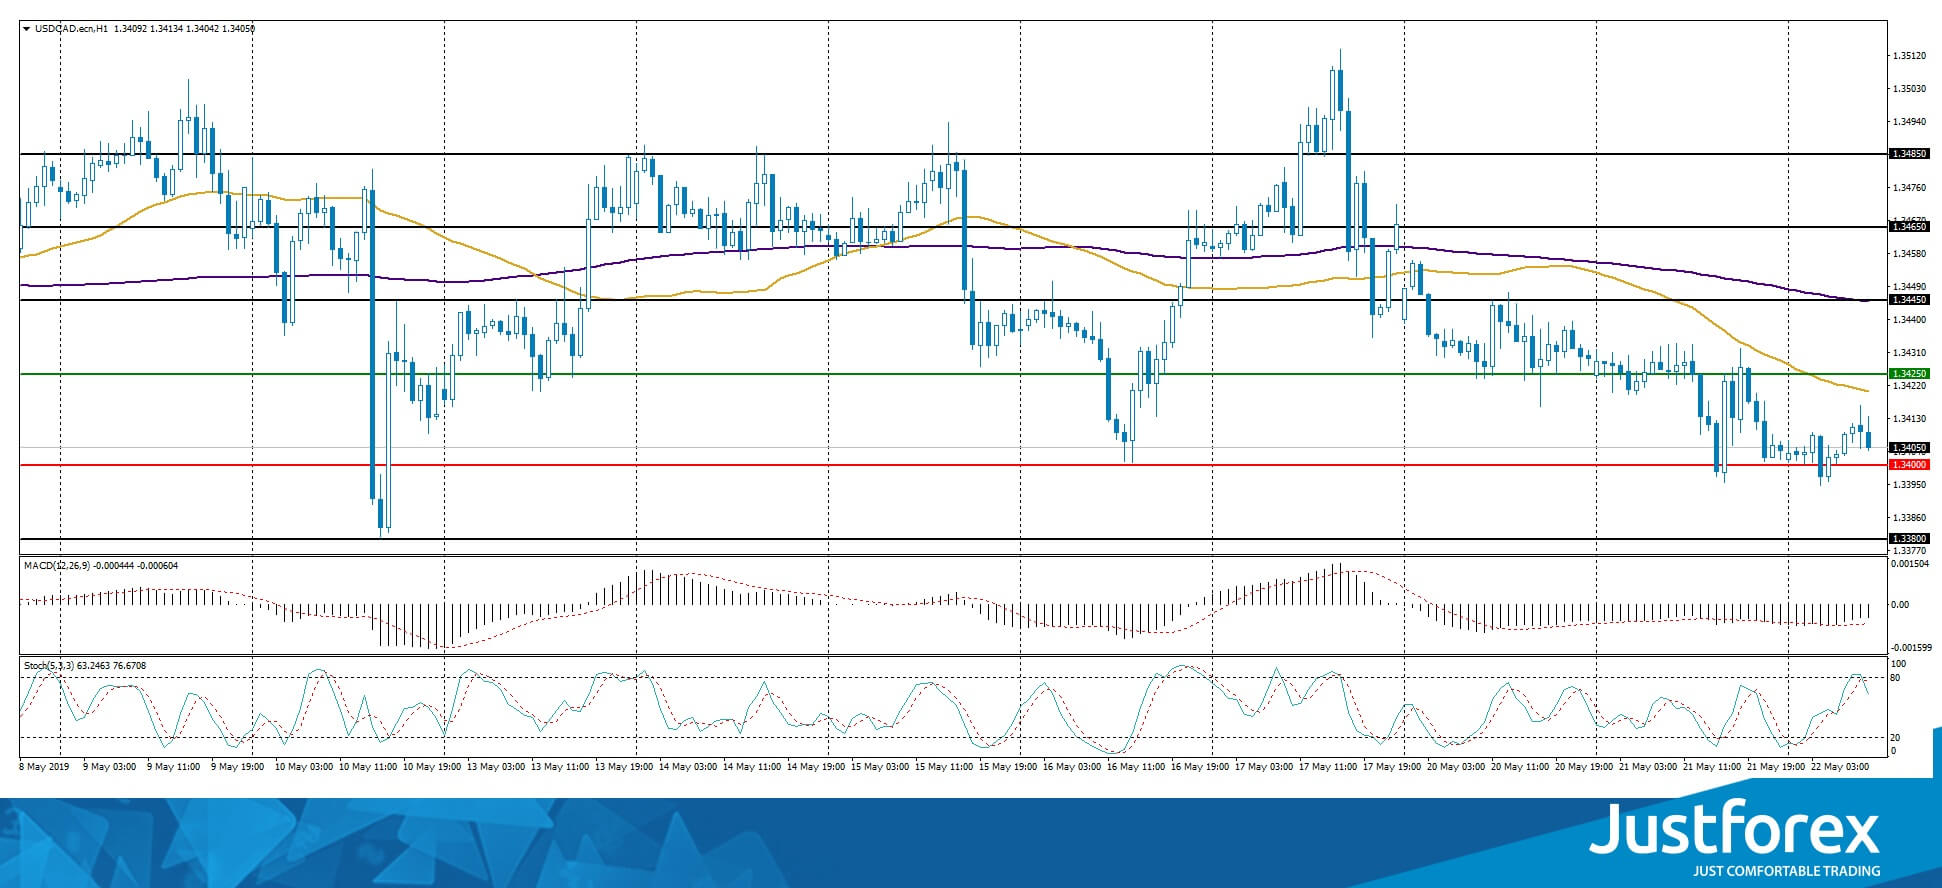
The price fixed below 50 MA and 200 MA which points toward the power of the sellers.
The MACD histogram is in the negative zone but above the signal line which gives a weak signal to sell USD/CAD.
The Stochastic Oscillator is in the neutral zone, the %K line is crossing the %D line. There are no signals at the moment.
Trading recommendations
Support levels: 1.34000, 1.33800
Resistance levels: 1.34250, 1.34450, 1.34650
If the price fixes below the round 1.34000, expect further descend towards 1.33800-1.33600.
Alternatively, the quotes can grow towards 1.34400-1.34600.
The USD/JPY currency pair
Technical indicators of the currency pair:
Prev Open: 110.068
Open: 110.484
% chg. over the last day: +0.46
Day’s range: 110.362 – 110.626
52 wk range: 104.97 – 114.56
USD/JPY started to grow again and updated the local maximums. The key support and resistance levels are 110.300 and 110.650. The quotes can grow further. The market participants are waiting for the FOMC Minutes. Keep an eye on the US Treasury bonds and open positions from the key levels.
During the Asian trading session Japan published weak trading balance reports.
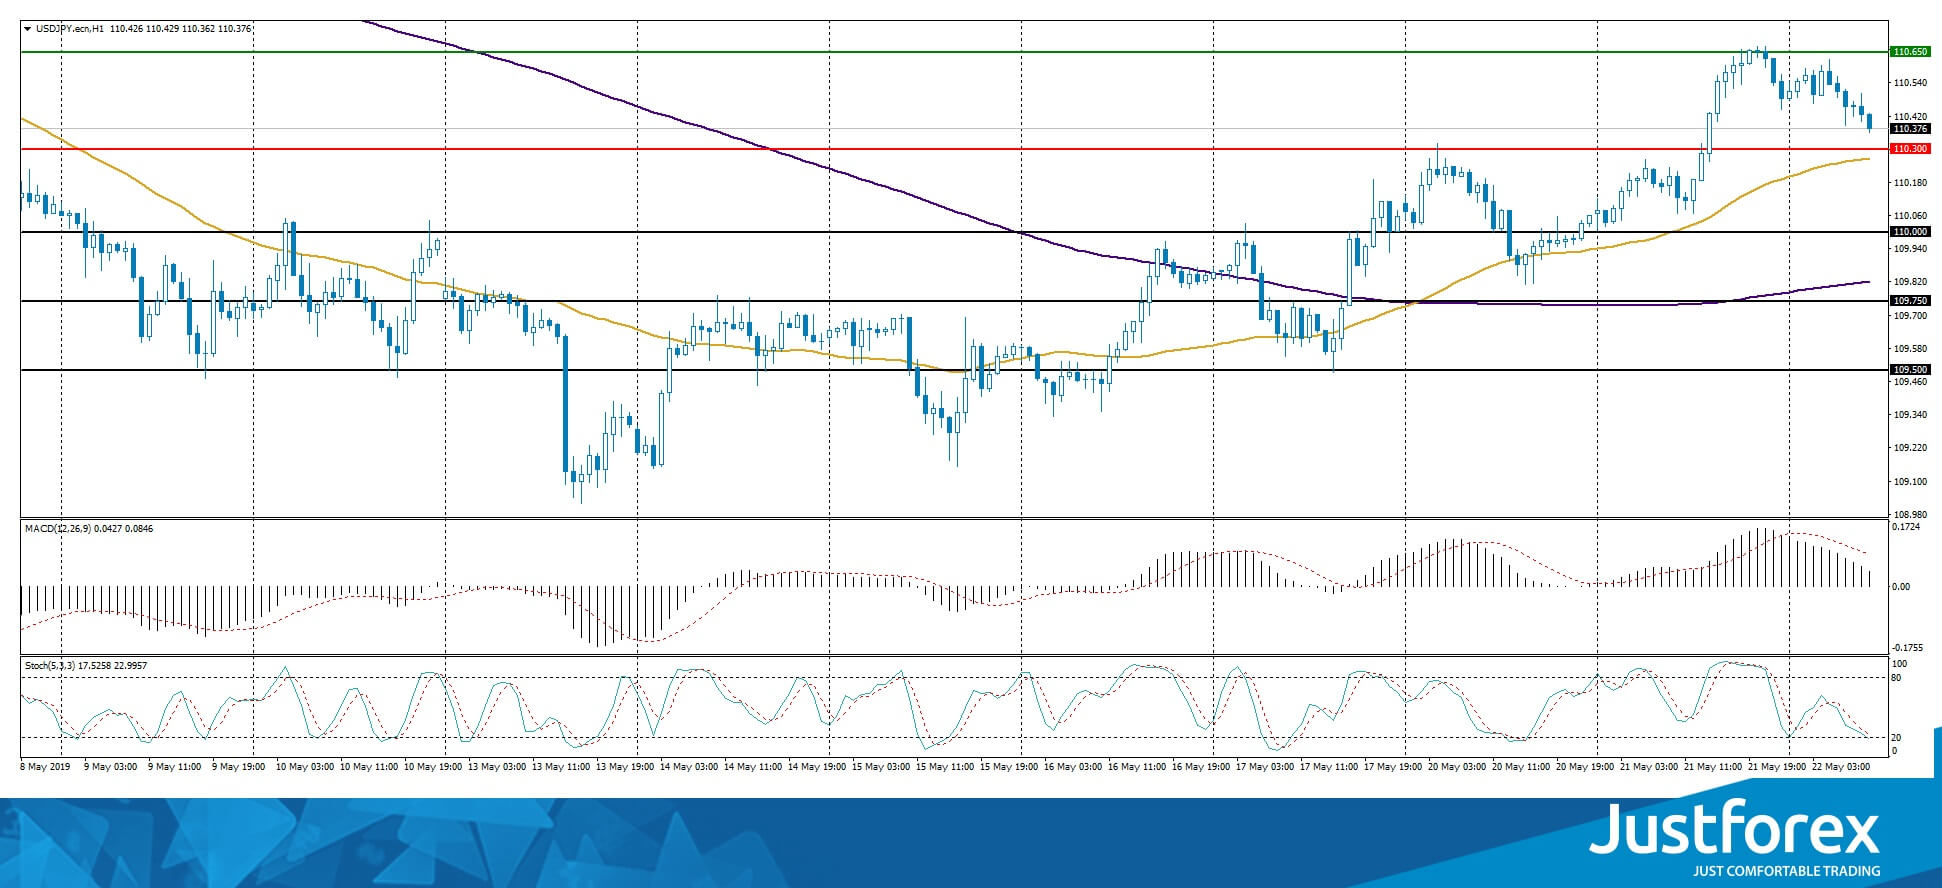
The price fixed above 50 MA and 200 MA which points towards the power of the buyers.
The MACD histogram is in the positive zone but below the signal line which gives a weak signal to buy USD/JPY.
The Stochastic Oscillator is in the neutral zone, the %K line is below the %D line which points towards a bearish mood.
Trading recommendations
Support levels: 110.300, 110.000, 109.750
Resistance levels: 110.650, 111.000
If the price fixes above 110.650, expect further growth towards 111.000.
Alternatively, the quotes can fall towards 110.000-109.750.


