
Key Highlights
- The US Dollar found support near 109.20 and recently recovered against the Japanese Yen.
- USD/JPY failed near 109.90 and remained below a key bearish trend line on the 4-hours chart.
- The US GDP grew 3.1% in Q1 2019, according to the “second” estimate.
- The US Personal Income in April 2019 could rise 0.3% (MoM), more than the last +0.1%.
USDJPY Technical Analysis
After a solid decline, the US Dollar found a strong buying interest near 109.20 against the Japanese Yen. The USD/JPY pair started a short-term rebound and traded above the 109.40 and 109.50 resistance levels.
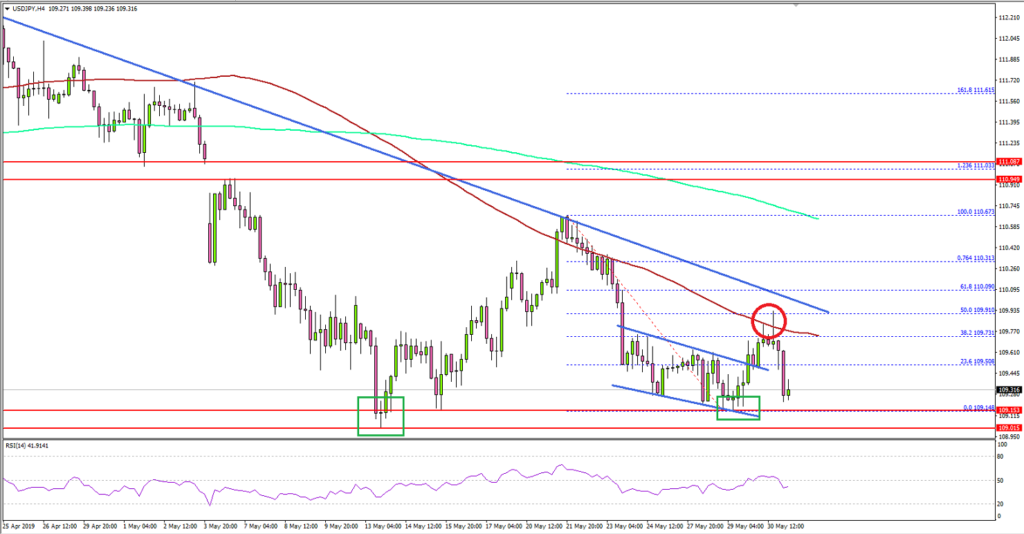
Looking at the 4-hours chart, the pair seems to have formed a solid support above the 109.10 and 109.15 levels. It broke a declining channel near 109.50 to enter a positive zone.
Moreover, the pair surpassed the 109.75 resistance plus the 38.2% Fib retracement level of the downward move from the 110.67 high to 109.14 low. On the upside, the pair failed near the 109.90 resistance level and remained below a key bearish trend line.
Besides, the pair struggled to surpass the 50% Fib retracement level of the downward move from the 110.67 high to 109.14 low, plus the 100 simple moving average (red, 4-hours).
To start a decent recovery, the pair must surpass the 109.90 and 110.00 resistance levels. A successful close above the bearish trend line and 110.00 could open the doors for a larger recovery.
Conversely, if there is no upside break above 109.90 or 110.00, the pair might decline again towards the 109.15 support level. The main support is near 109.10, below which the pair may well decline heavily.
Fundamentally, the US Gross Domestic Product report for Q1 2019 was released by the US Bureau of Economic Analysis. The market was looking for the GDP to grow by 3.1% in Q1 2019.
The actual result was similar to the forecast, as the US GDP grew 3.1% in Q1 2019, according to the “second” estimate. However, the first quarter GDP rate is less than the last 3.2%.
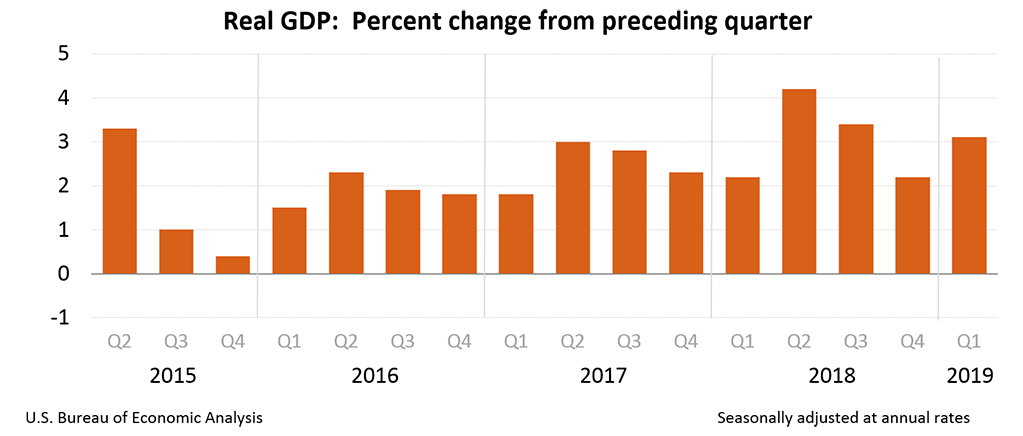
Real gross domestic income (GDI) increased 1.4 percent in the first quarter, compared with an increase of 0.5 percent (revised) in the fourth quarter. The average of real GDP and real GDI, a supplemental measure of U.S. economic activity that equally weights GDP and GDI, increased 2.2 percent in the first quarter, compared with an increase of 1.3 percent in the fourth quarter.
Looking at other major pairs, both EUR/USD and GBP/USD declined heavily and they might continue to struggle in the near term.
Economic Releases to Watch Today
- German CPI May 2019 (YoY) (Prelim) – Forecast +1.6%, versus +2.0% previous.
- German CPI May 2019 (MoM) (Prelim) – Forecast +0.3%, versus +1.0% previous.
- US Personal Income April 2019 (MoM) – Forecast +0.3%, versus +0.1% previous.
- Canadian GDP Q1 2019 (Annualized) – Forecast +1.2%, versus 0.4% previous.


