
The EUR/USD currency pair
Technical indicators of the currency pair:
Prev Open: 1.11288
Open: 1.11603
% chg. over the last day: +0.34
Day’s range: 1.11599 – 1.11900
52 wk range: 1.1111 – 1.2009
EUR/USD started to grow. The trading instrument updated the local maximums. The investors are worried about the escalation in the trading conflict. Donald Trump said that on June 10, Washington will introduce 5% fees o the goods from Mexico should the local leaders fail to stop the stream of illegal immigrants into the US. The EUR/USD quotes are consolidating around 1.11700-1.11900. Further growth of EUR is highly probable. Expect more economic releases and open positions from the key levels.
The Economic News Feed for 03.06.2019:
Industrial PMI (GER) – 10:55 (GMT+3:00);
Industrial PMI (US) – 17:00 (GMT+3:00);
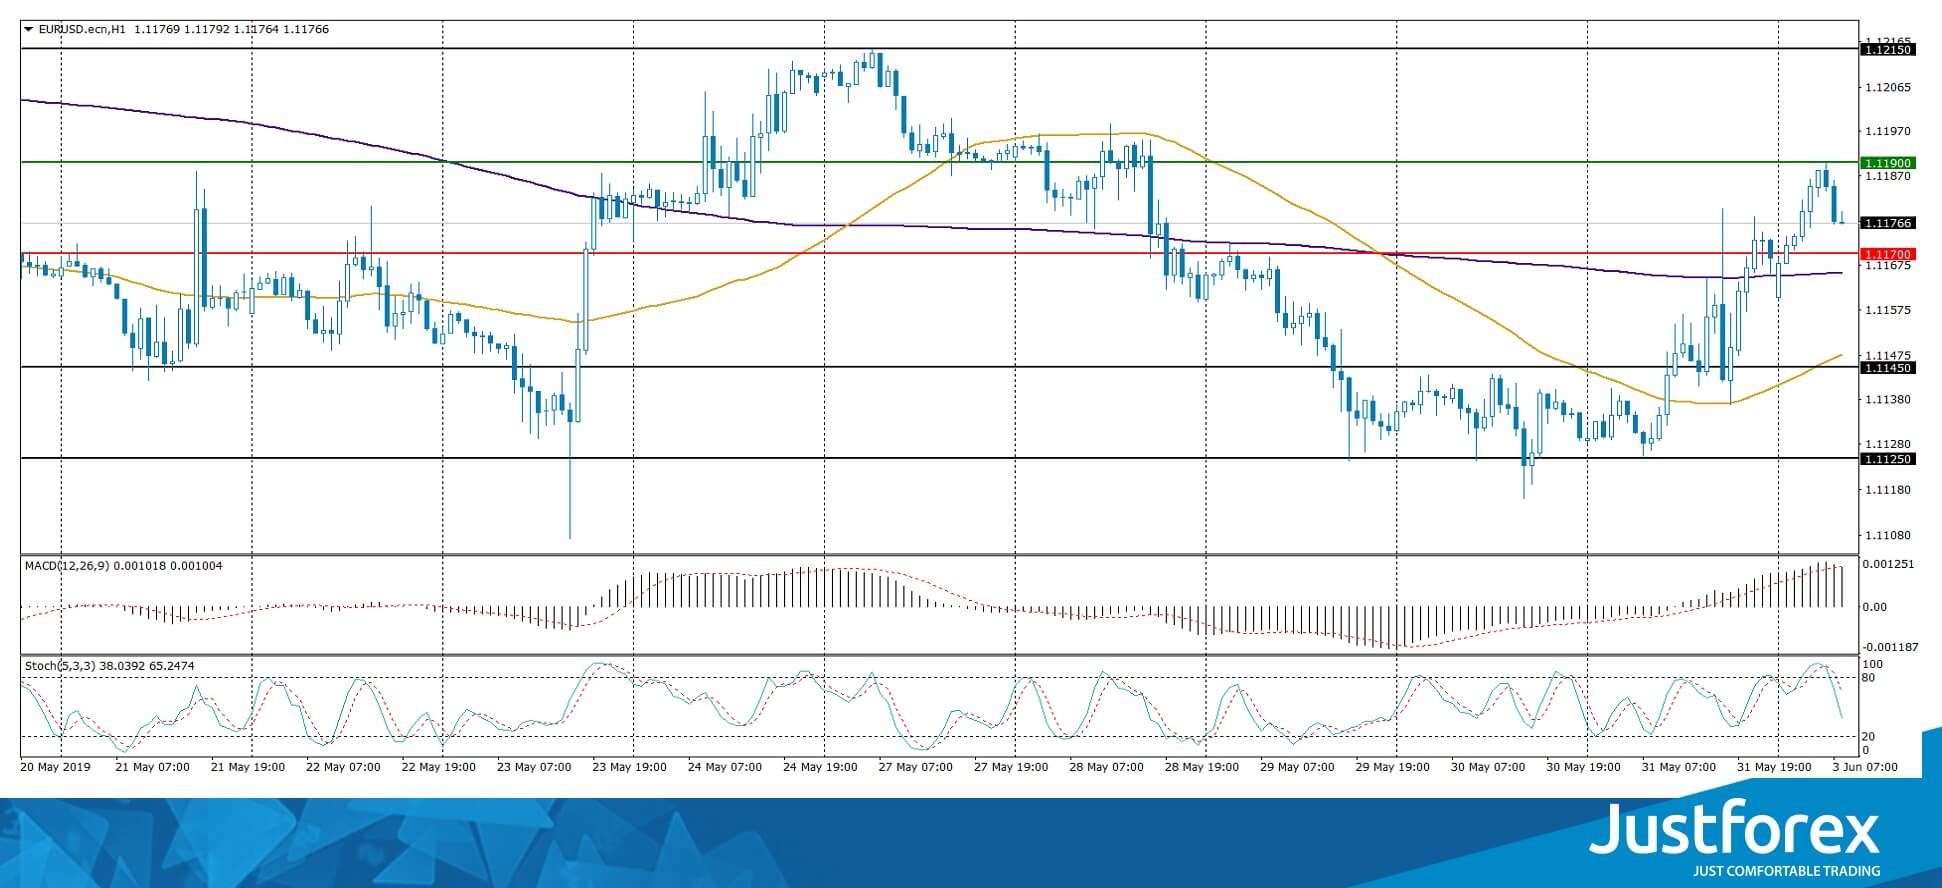
The price fixed above 200 MA which points to the power of the buyers.
The MACD histogram is in the positive zone and above the signal line which gives a strong signal to buy EUR/USD.
The Stochastic Oscillator is in the neutral zone, the %K line is below the %D line which points to the bearish mood.
Trading recommendations
Support levels: 1.11700, 1.11450, 1.11250
Resistance levels: 1.11900, 1.12150
If the price fixes above 1.11900, expect further growth towards 1.12150-1.12300.
Alternatively, the quotes can fall towards 1.11450-1.12300.
The GBP/USD currency pair
Technical indicators of the currency pair:
Prev Open: 1.26091
Open: 1.26264
% chg. over the last day: +0.19
Day’s range: 1.26178 – 1.26552
52 wk range: 1.2438 – 1.3631
GBP/USD started to recver. Trading instrument set the new local maximums. The financial market participants started to fix the USD positions. Today Donald Trump will visit Great Britain. GBP/USD is consolidating. Local support and resistance are 1.26250 and 1.26550. GBP can correct further. You should open positions from the key levels.
At 11:30 (GMT+3:00) Great Britain will publish an industrial PMI.
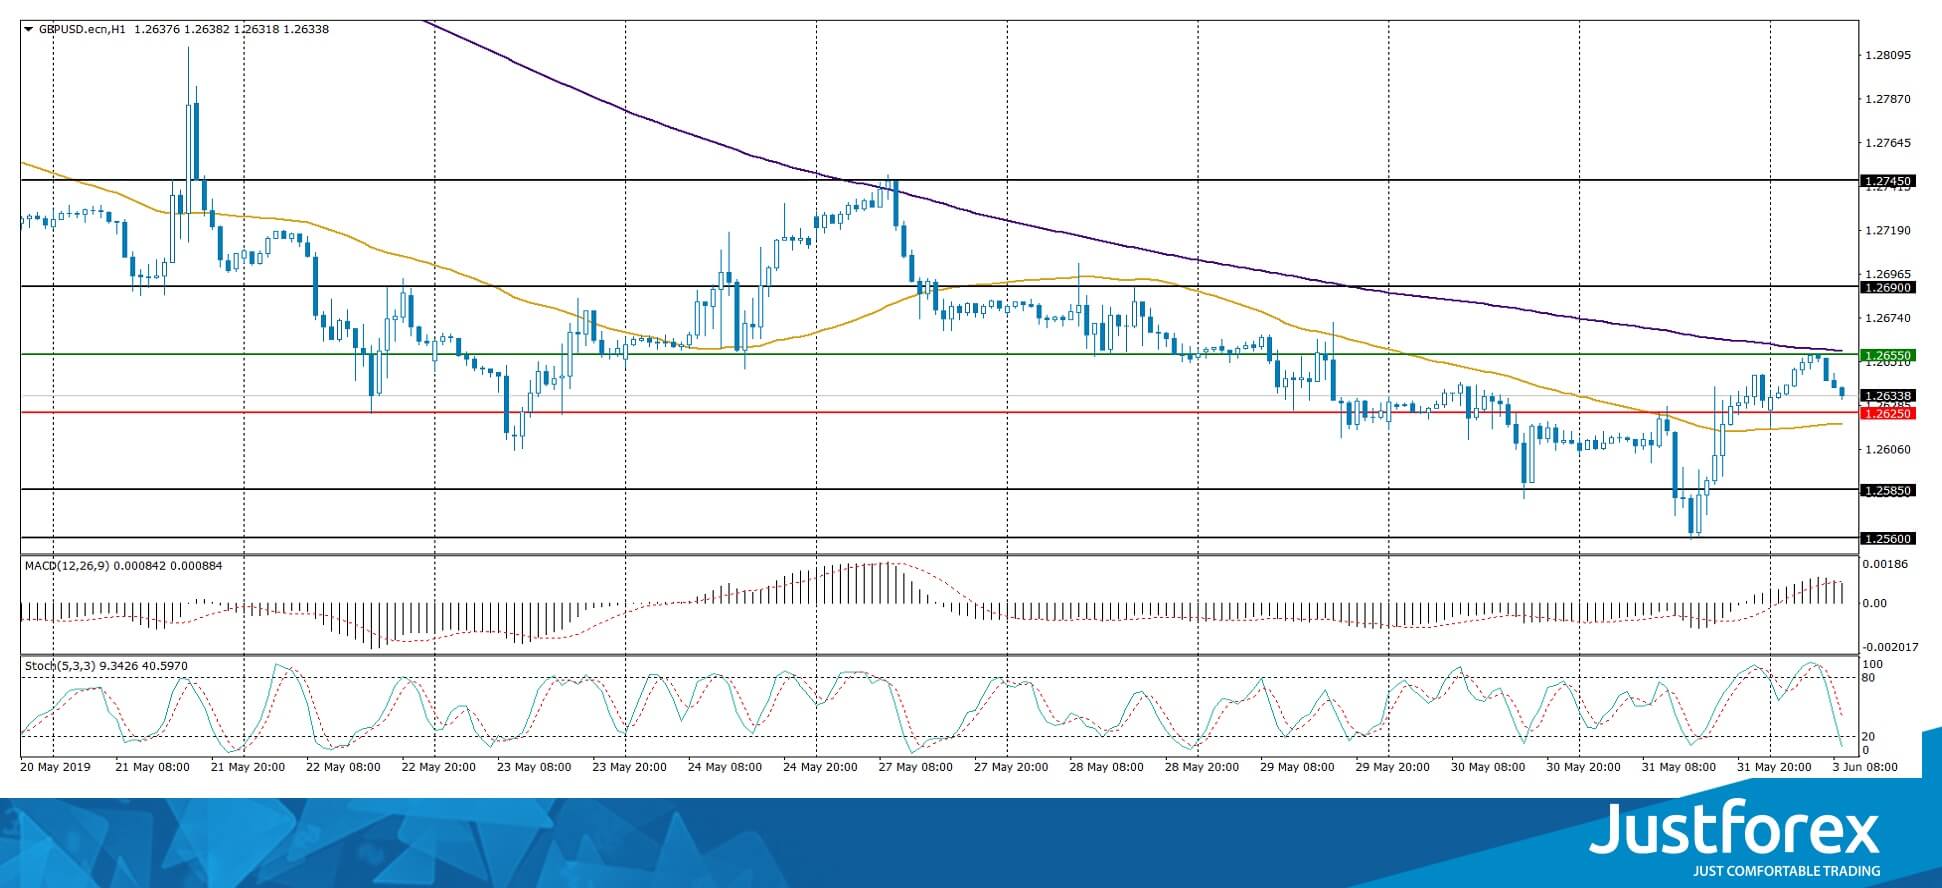
The indicators do not provide precise signlas, the price fixed between 50 MA and 200 MA.
The MACD histogram is in the positive zone but below the signal line which gives a weak signal to sell GBP/USD.
The Stochastic Oscillator is in the neutral zone, the %K line is below the %D line which points to a bearish mood..
Trading recommendations
Support levels: 1.26250, 1.25850, 1.25600
Resistance levels: 1.26550, 1.26900, 1.27450
If the price fixes above 1.26550, expect further correction towards 1.27000.
Alternatively, the quotes can fall towards 1.25850-1.25600.
The USD/CAD currency pair
Technical indicators of the currency pair:
Prev Open: 1.35164
Open: 1.35168
% chg. over the last day: +0.06
Day’s range: 1.34918 – 1.35270
52 wk range: 1.2727 – 1.3664
USD/CAD has an ambiguous technical picture. CAD is moving sideways. The key support and resistance levels are 1.34850 and 1.35250. USD/CAD has prospects for correction after a long rally. We expect reports from the US. Keep an eye on the oil quotes dynamics and open positions from the key levels.
The Economic News Feed for 03.06.2019 is calm.
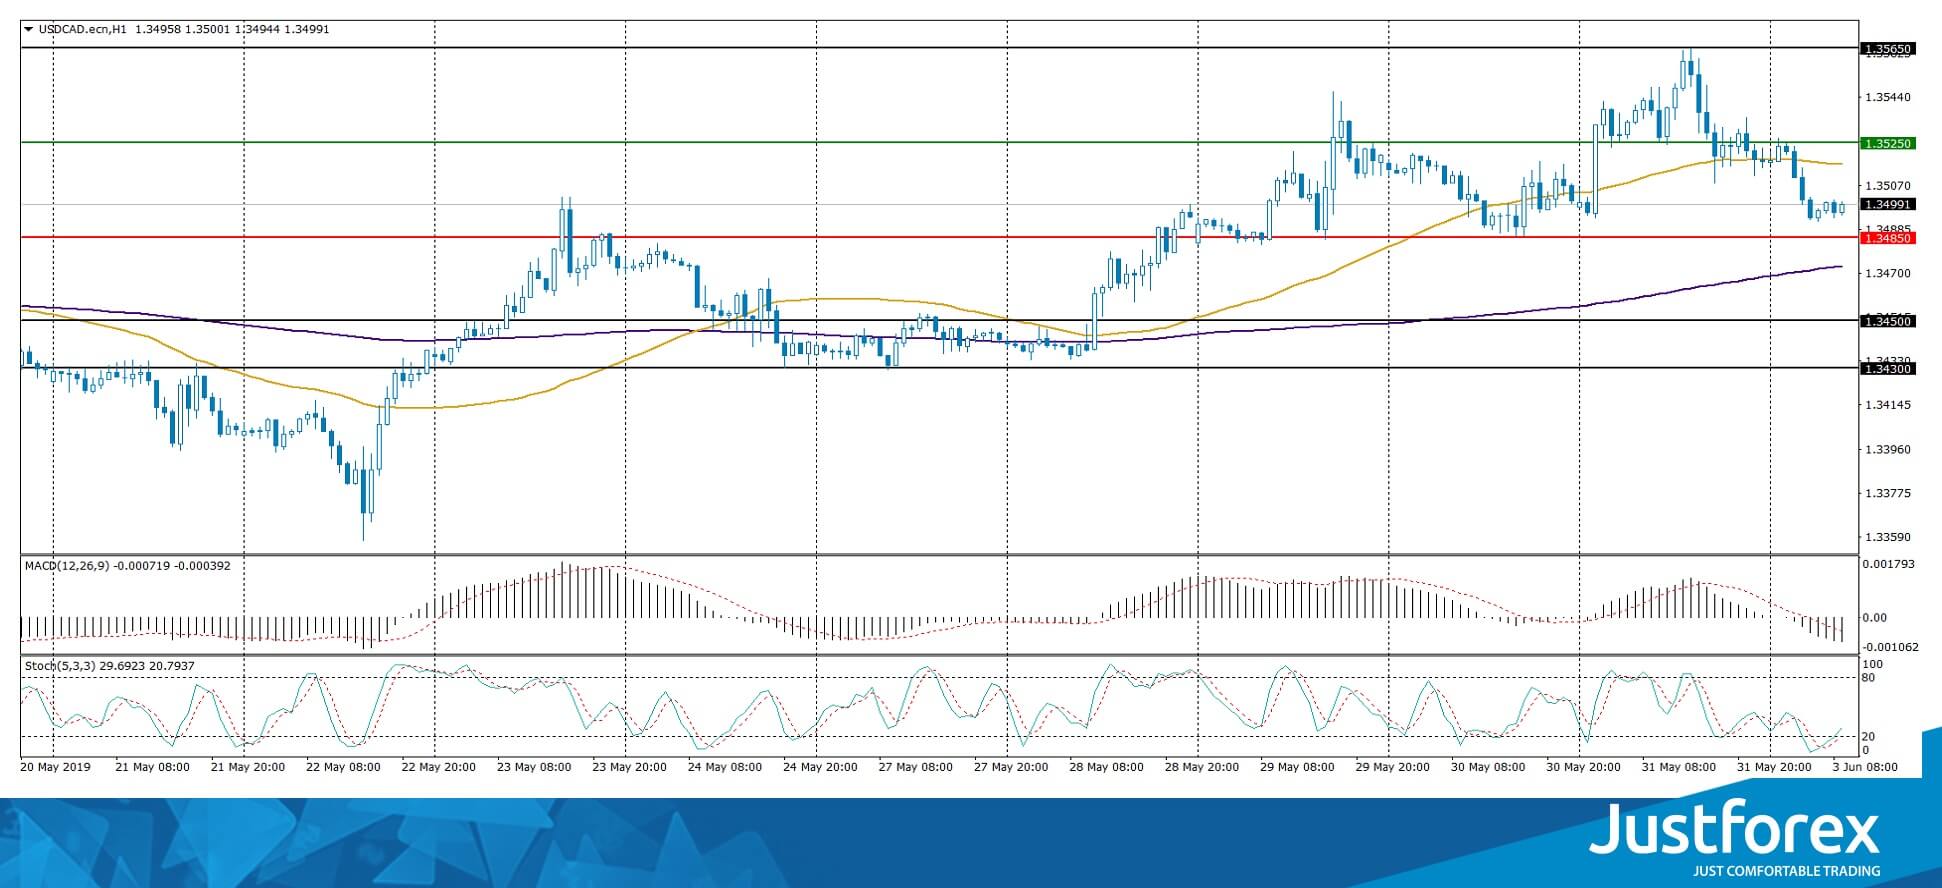
The indicators do not provide precise signals, the price fixed between 50 MA and 200 MA.
The MACD histogram is in the negative zone and keeps descending which gives a signal to sell USD/CAD.
The Stochastic Oscillator is in the oversold zone, the %K line is crossing the %D line. There are no signals at the moment.
Trading recommendations
Support levels: 1.34850, 1.34500, 1.34300
Resistance levels: 1.35250, 1.35650
If the price fixes below 1.34850 expect correction towards 1.34500-1.34300.
Alternatively, the qutoes can grow toward 1.35500-1.35700.
The USD/JPY currency pair
Technical indicators of the currency pair:
Prev Open: 109.596
Open: 108.264
% chg. over the last day: -1.21
Day’s range: 108.070 – 108.343
52 wk range: 104.97 – 114.56
USD/JPY shows agressive sales. On Friday, May 31 the quotes fell by 130 points and updated the key minimums. The demand on the safe assets grew after a trading conflict escalation. Donald Trump aanounced a 5% fee on the imported goods from Mexico, starting on June 10. The quotes are consolidating around 108.000 with 108.400 acting as a local resistance. USD/JPY can descend further.
Keep an eye on the US news feed.
Economic Event (JPY) – 00:00 (GMT+3:00);
Economic Event (JPY) – 00:00 (GMT+3:00);
Economic Event (JPY) – 00:00 (GMT+3:00);
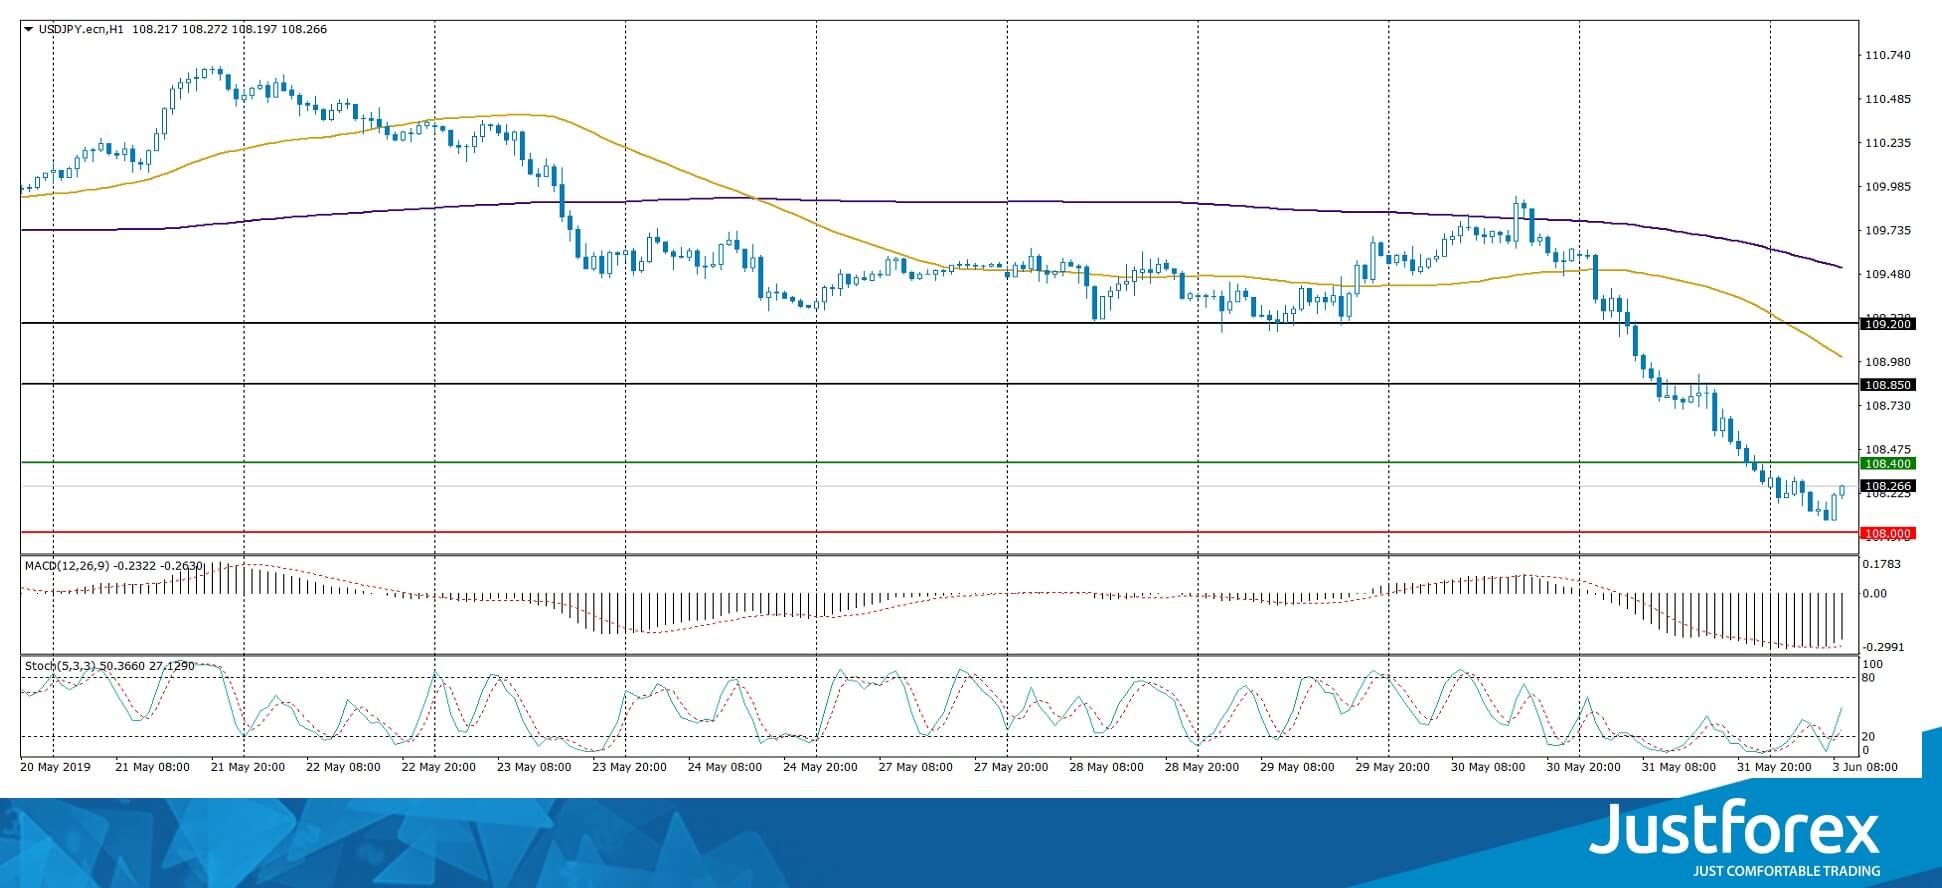
The price fixed below 50 MA and 200 MA which points to the power of the buyers.
The MACD histogram is in the negative zone but above the signal line which gives a weak signal to sell USD/JPY.
The Stochastic Oscillator started to leave the oversold aone, the %K line is above the %D line which points to a correction.
Trading recommendations
Support levels: 108.000, 107.500
Resistance levels: 108.400, 108.850, 109.200
If the price fixes below the round 108.000 expect further descend towards 107.600-107.400.
Alternatively, the qutoes can recover towards 108.700-109.000.


