
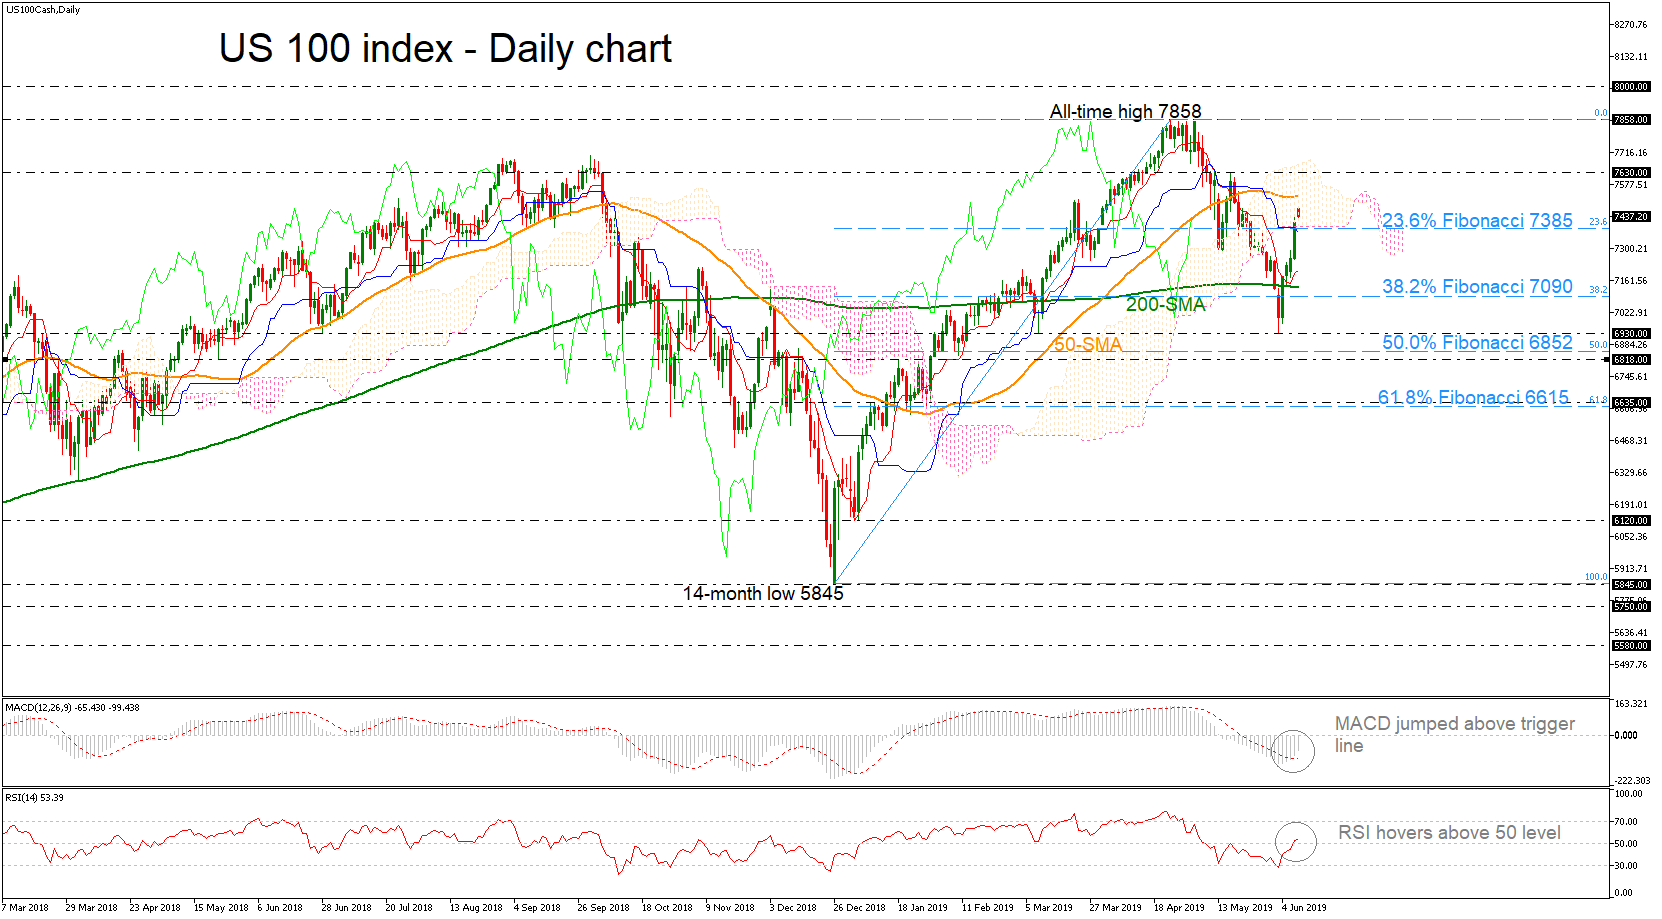
The US 100 index advanced considerably in the previous week, penetrating the Ichimoku cloud following the rebound on the 6930 support level. However, the bulls have so far been unable to push the price above the 50-day simple moving average (SMA), but the technical indicators are moving north. The MACD surpassed the trigger line in the negative area while the RSI climbed above the 50 level.
In case of further advances, a first line of resistance may be found near the 7630 barrier and the upper surface of the Ichimoku cloud. A decisive break above that area would turn the picture to a more neutral one and open the door for a test of the all-time high of 7858. Even higher, the outlook could turn to strongly bullish recording a new peak.
On the flipside, a pullback in the market may encounter support near the 23.6% Fibonacci of the upward wave of 5845 to 7858 near 7385, with a downside break paving the way for the 200-SMA currently at 7130.
Currently, the index is trying to pare previous losses and could change the recent bias to bullish if there is a daily close above the all-time high (7858).


