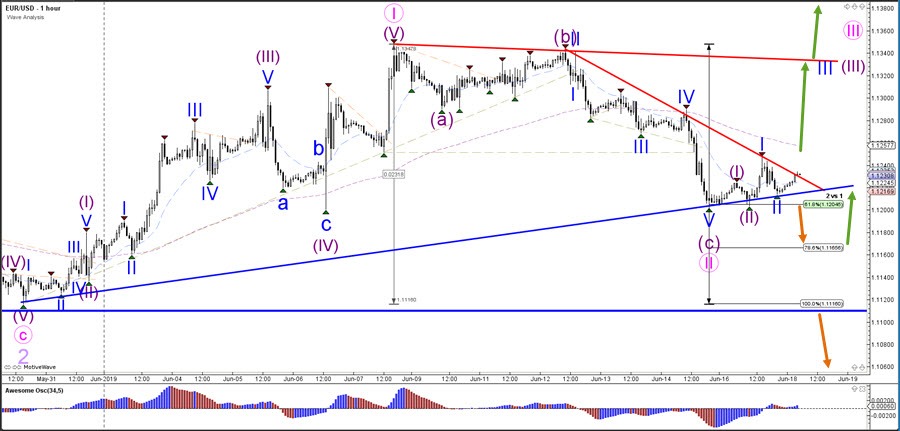
The EUR/USD break below the support trend line (blue) indicates that the bears remain in control and could start a drop towards the 78.6% and 88.6% Fibonacci levels of wave 2 vs 1. A larger downtrend, however, only is confirmed once price breaks and closes (on daily chart) below the critical 1.11 support. A break above the resistance trend line (red) indicates a bullish breakout and potentially the end of the wave 2 (pink) retracement.
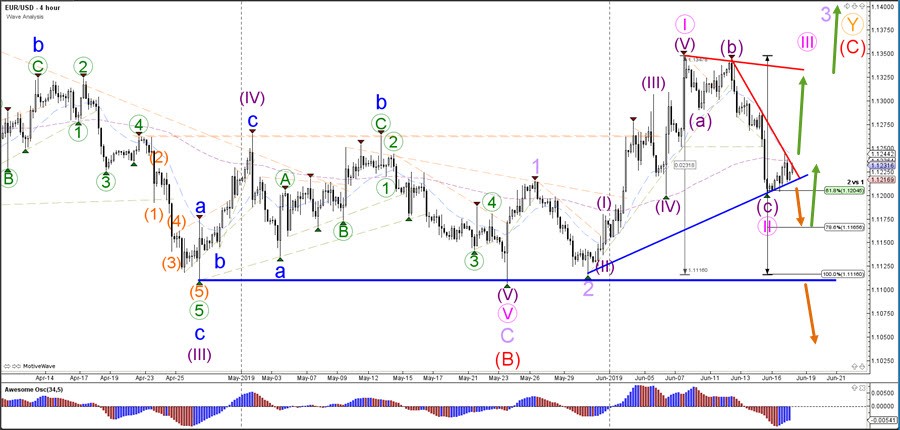
The EUR/USD could either be building a bear flag continuation pattern or multiple waves 1-2 of a new uptrend. This will depend on whether price can break below the support (blue) or above the resistance (red) trend lines. This wave pattern outlook is indicating that a bearish ABC (purple) seems completed and hence the development a bullish reversal has an advantage over the bearish scenario.