
The EUR/USD currency pair
Technical indicators of the currency pair:
Prev Open: 1.13643
Open: 1.12849
% chg. over the last day: -0.64
Day’s range: 1.12752 – 1.12919
52 wk range: 1.1111 – 1.2009
Aggressive sales happened on the EUR/USD yesterday. The drop exceeded 80 points. Trading instrument updated the local lows. The euro was under pressure after the publication of weak economic reports from Germany and the eurozone. At the same time, positive reports on business activity in the US manufacturing sector from ISM supported the demand for USD. At the moment, EUR/USD quotes are consolidating. The key range is 1.12750-1.13150. We do not exclude a further decline in the single currency. We recommend to open positions from key levels.
The Economic News Feed for 02.07.2019 is calm.
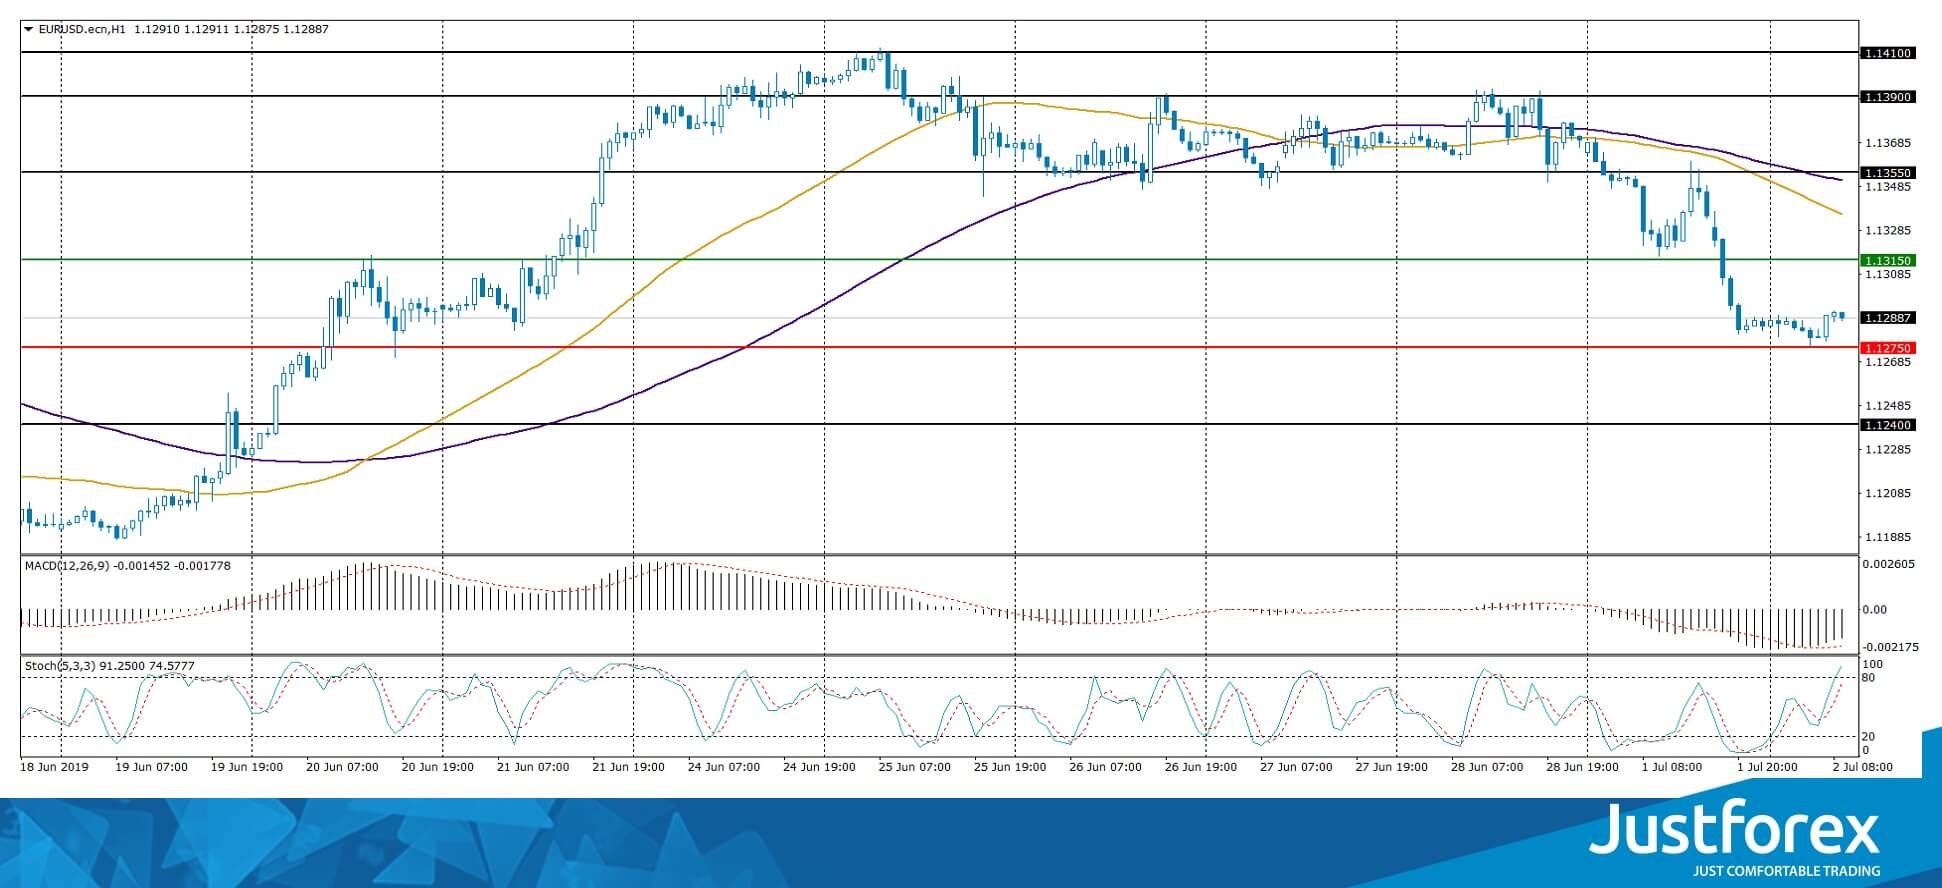
Indicators point to the strength of sellers: the price has fixed below 50 MA and 100 MA.
The MACD histogram is in the negative zone, but above the signal line, which gives a weak signal to sell EUR/USD.
The Stochastic Oscillator is in the neutral zone, the %K line is above the %D line, which indicates bullish moods.
Trading recommendations
Support levels: 1.12750, 1.12400
Resistance levels: 1.13150, 1.13550, 1.13900
If the price consolidates below the local support of 1.12750, the quotes will fall toward 1.12400-1.12200.
Alternatively the quotes could recover towards 1.13400-1.13600.
The GBP/USD currency pair
Technical indicators of the currency pair:
Prev Open: 1.26940
Open: 1.26374
% chg. over the last day: -0.39
Day’s range: 1.26259 – 1.26478
52 wk range: 1.2438 – 1.3631
GBP/USD has started to decline. Yesterday, the quotes fell by more than 50 points and updated local minima. The UK has published weak statistics on business activity in the manufacturing sector of the country for June. The trading instrument found support at 1.26300. Mark 1.26650 is already a “mirror” resistance. Sterling has the potential to further decline. We recommend to keep up to date information on Brexit. Positions must be opened from key levels.
At 11:30 (GMT + 3:00) the business activity index in the UK construction sector will be published.
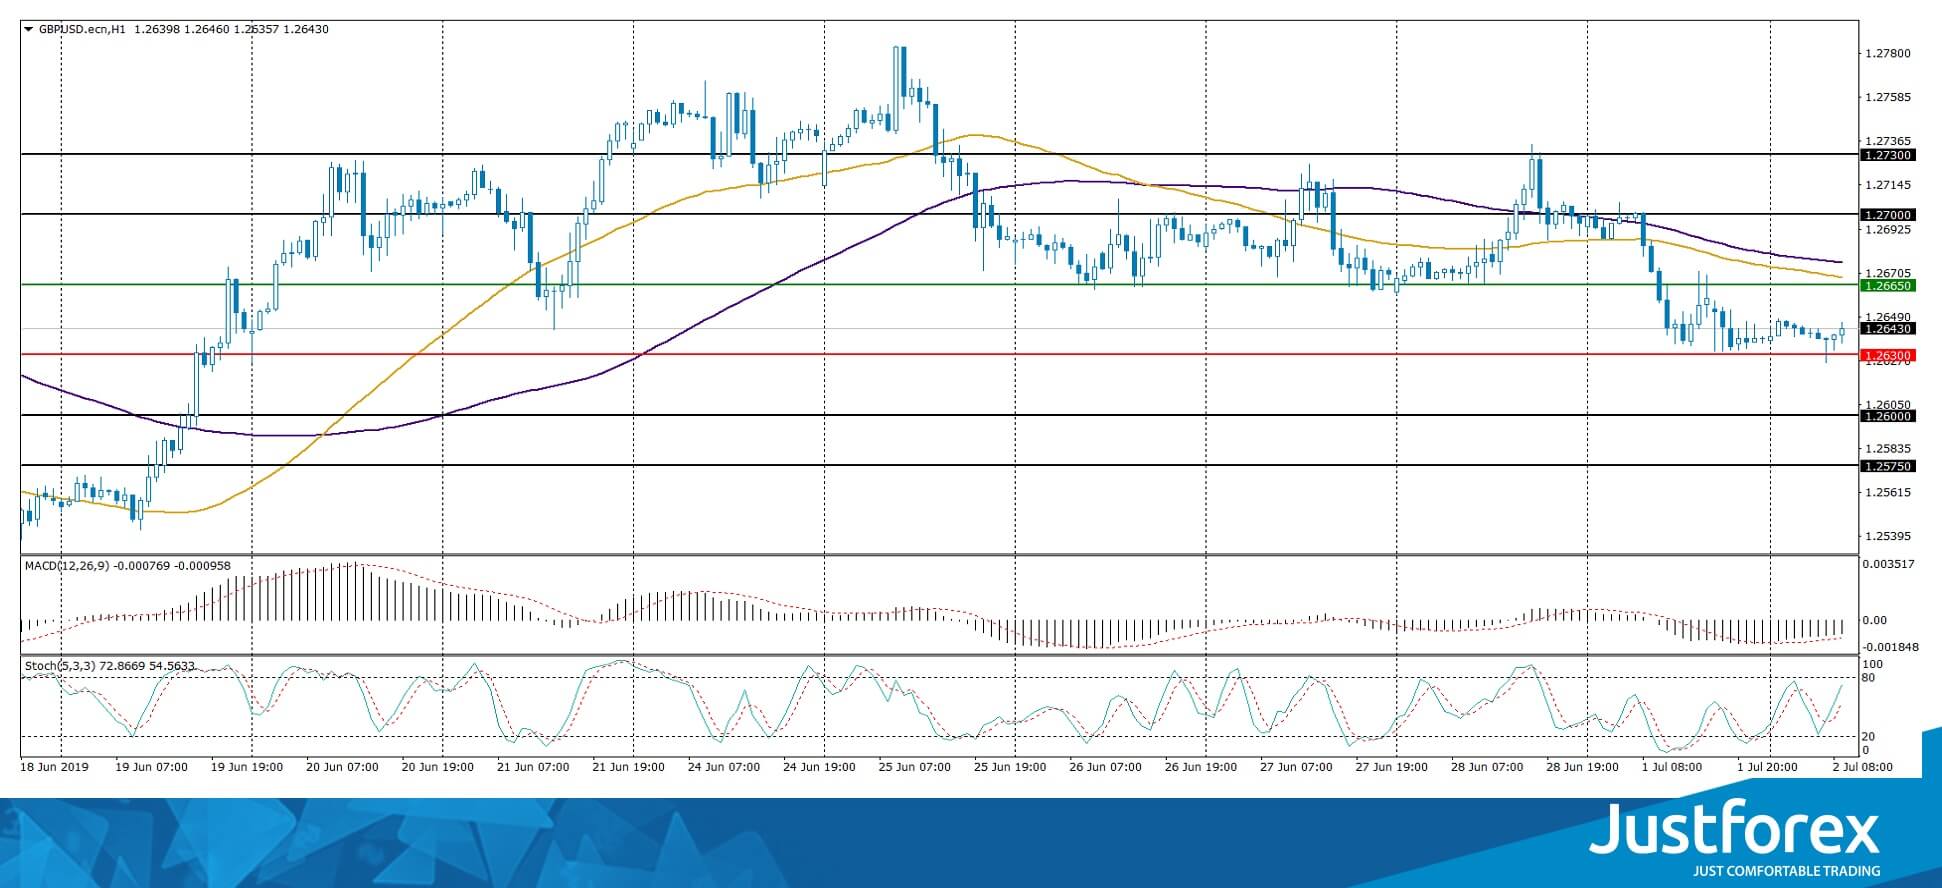
The price has fixed below 50 MA and 100 MA, which indicates the strength of the sellers.
The MACD histogram is in the negative zone but above the signal line, which gives a weak signal to sell GBP/USD.
Stochastic Oscillator is in the neutral zone, the %K line is above the %D line, which indicates a bullish mood.
Trading recommendations
Support levels: 1.26300, 1.26000, 1.25750
Resistance levels: 1.26650, 1.27000, 1.27300
If the price consolidates below 1.26300, the quotes will drop toward 1.26000-1.25750.
Alternatively, the quotes can grow towards 1.27000.
The USD/CAD currency pair
Technical indicators of the currency pair:
Prev Open: 1.30843
Open: 1.31331
% chg. over the last day: +0.34
Day’s range: 1.31142 – 1.31386
52 wk range: 1.2727 – 1.3664
The USD/CAD began to recover after a long fall. During yesterday’s trading, the growth of the quotes exceeded 50 pips. The trading instrument has updated the local maximums. At the moment, CAD is consolidating. The key support and resistance levels are 1.31000 and 1.31500. The current technical picture signals a further correction of the currency pair. We recommend to open positions from key levels.
The Economic News Feed for 02.07.2019 is calm.
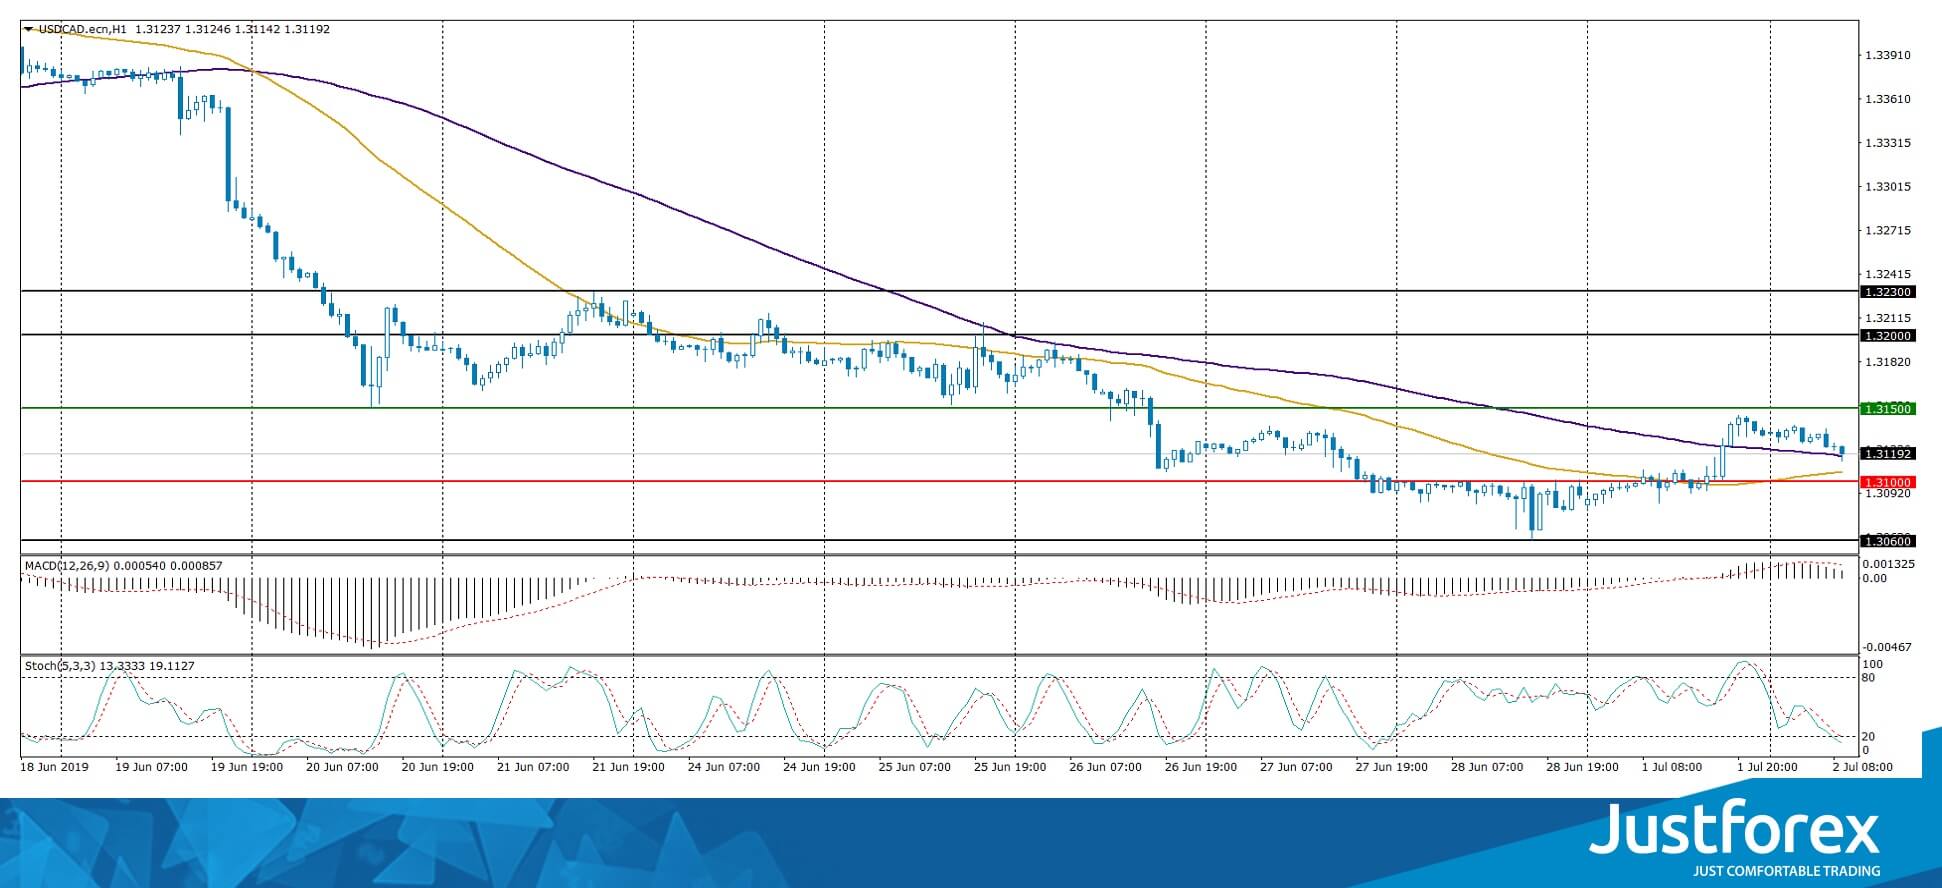
The indicators do not give accurate signals: the price has crossed 100 MA.
The MACD histogram is in the positive zone, but below the signal line, which gives a weak signal to buy USD/CAD.
Stochastic Oscillator is located near the oversold zone, the %K line is below the %D line, which indicates bearish moods.
Trading recommendations
Support levels: 1.31000, 1.30600
Resistance levels: 1.31500, 1.32000, 1.32300
If the price consolidates above the level of 1.31500, the quotes will rise towards 1.32000-1.32300.
Alternatively, the quotes could fall to 1.30700-1.30500.
The USD/JPY currency pair
Technical indicators of the currency pair:
Prev Open: 108.288
Open: 108.427
% chg. over the last day: +0.08
Day’s range: 108.274 – 108.475
52 wk range: 104.97 – 114.56
The USD/JPY has stabilized. The trading instrument is in a lateral movement. The key support and resistance levels are 108.100 and 108.500. USD/JPY quotes can grow further further. The demand for safe assets weakened after the conclusion of a temporary truce in the trade conflict between the United States and China. We recommend to pay attention to the dynamics of the yield of US government bonds. Positions must be opened from key levels.
The Economic News Feed for 02.07.2019 is calm.
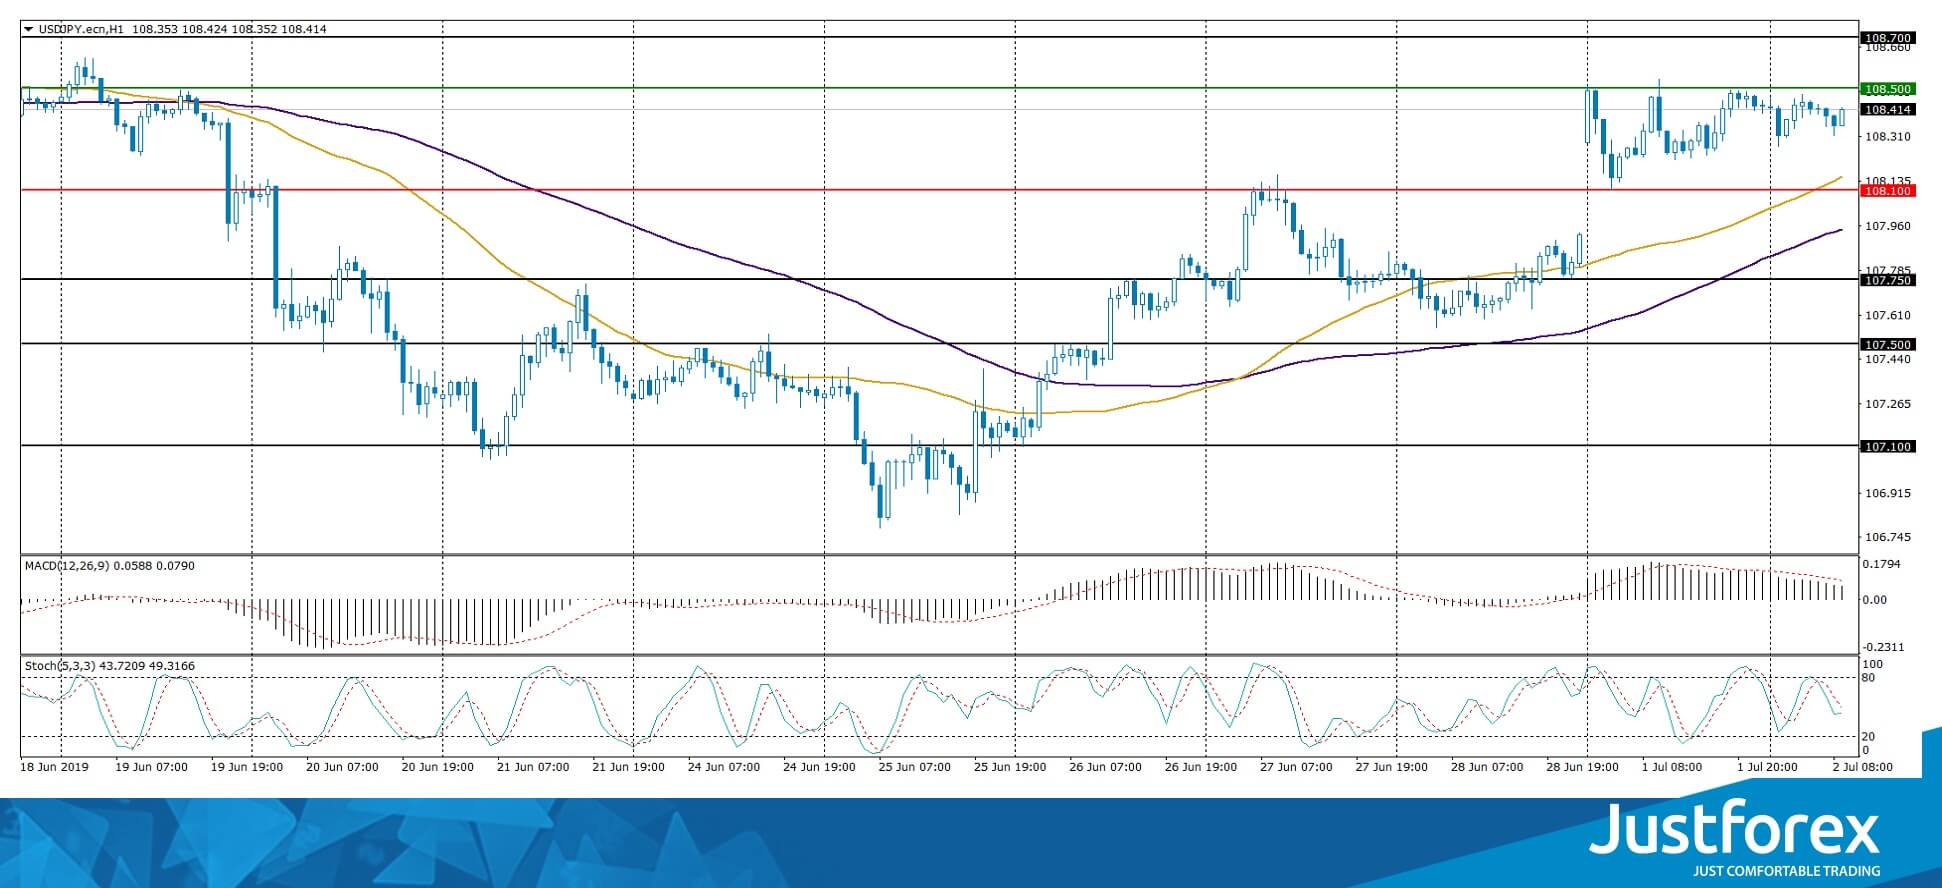
The price fixed above 50 MA and 100 MA which points to the power of the buyers.
The MACD histogram is in the positive zone but below the signal line which gives a weak signal towards buying USD/JPY.
The Stochastic Oscillator is in the neutral zone, the %K line is above the %D line. The indicator points to a bearish mood.
Trading recommendations
Support levels: 108.100, 107.750, 107.500
Resistance levels: 108.500, 108.700, 109.000
If the price fixes above 108.500, expect further growth towards 108.700-109.000.
Alternatively, the quotes can descend towards 107.750-107.500.


