
The EUR/USD currency pair
Technical indicators of the currency pair:
Prev Open: 1.12155
Open: 1.12087
% chg. over the last day: -0.12
Day’s range: 1.11890 – 1.12094
52 wk range: 1.1111 – 1.2009
The bearish mood prevails on the EUR/USD currency pair. Trading instrument updated the local lows. At the moment, the key support and resistance levels are 1.11850 and 1.12100. Financial markets participants are no longer sure that Fed will introduce a sharp reduction in the interest rate at the next meeting. Demand for USD slightly recovered. Quotes can decline further. You should open positions from key levels.
At 17:00 (GMT+3:00) the US will publish a secondary real estate sales report.
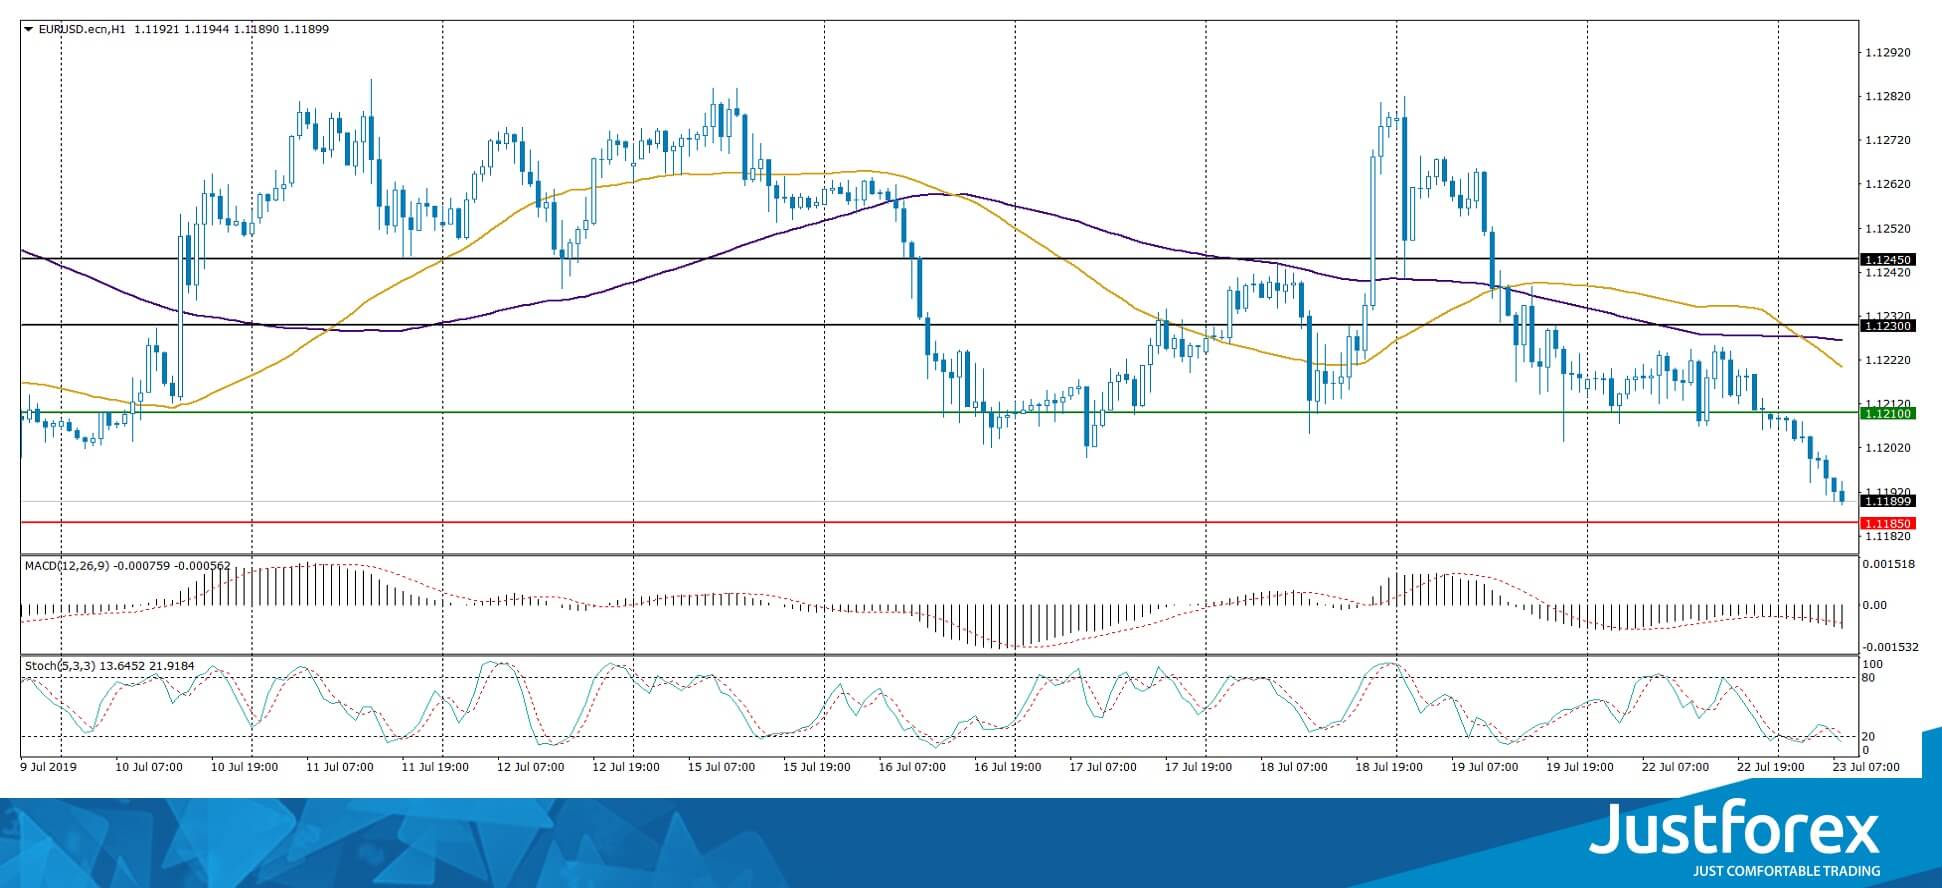
Indicators point to the strength of sellers: the price has fixed below 50 MA and 100 MA.
The MACD histogram is in the negative zone and below the signal line, which indicates a further drop in EUR/USD quotes.
Stochastic Oscillator is near the oversold zone, the %K line is below the %D line, which gives a weak signal to sell EUR/USD.
Trading recommendations
Support levels: 1.11850, 1.11500
Resistance levels: 1.12100, 1.12300, 1.12450
If the price fixes below 1.11850, expect further decline toward 1.11500-1.11300.
Alternatively, the quotes can grow toward 1.12300-1.1240.
The GBP/USD currency pair
Technical indicators of the currency pair:
Prev Open: 1.24313
Open: 1.24673
% chg. over the last day: -0.31
Day’s range: 1.24505 – 1.24788
52 wk range: 1.2397 – 1.3385
An ambiguous technical picture emerged on the GBP/USD currency pair. GBP is movind sideways, the local levels of support and resistance are 1.24500 and 1.24850. GBP remains under pressure due to the uncertainty around Brexit. The quotes can descend further. We expect important reports from the United States. Positions must be opened from key levels.
The Economic News Feed for 23.07.2019 is calm.
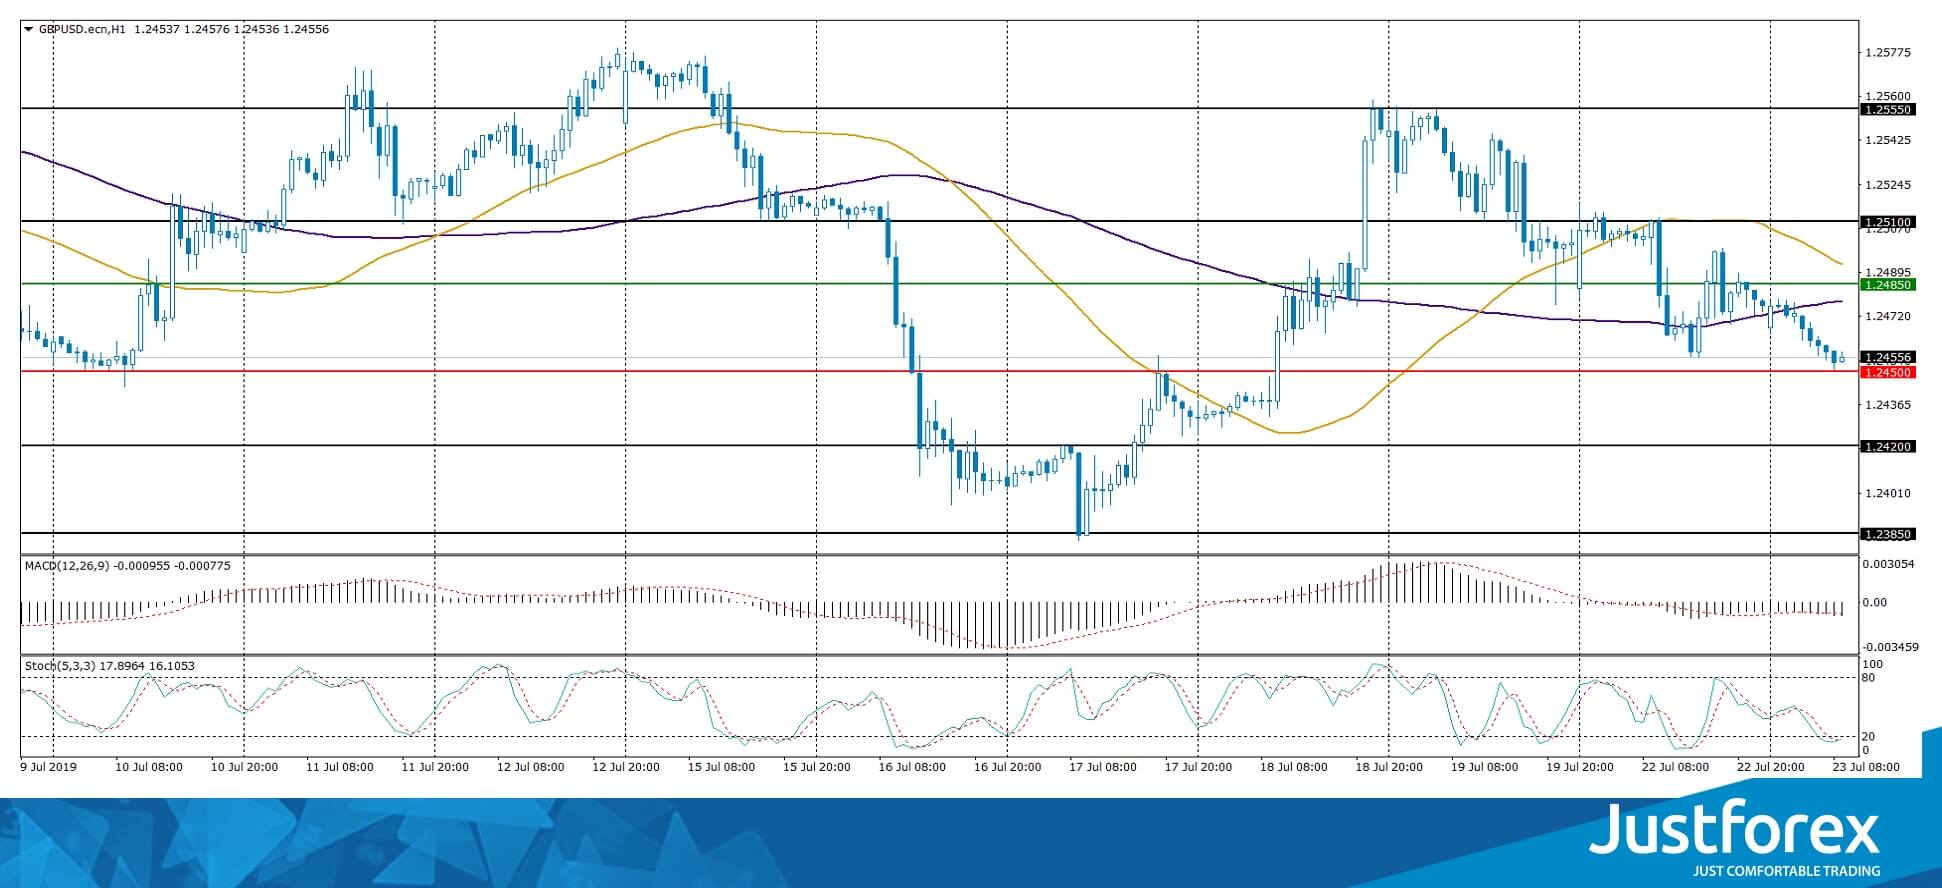
Indicators do not provide accurate signals, 50 MA started to cross 100 MA.
The MACD histogram is in the negative zone and below the signal line, indicating a drop in GBP/USD quotes.
Stochastic Oscillator is in the oversold zone, the %K line crossed the %D line. There are no signals at the moment.
Trading recommendations
Support levels: 1.24500, 1.24200, 1.23850
Resistance levels: 1.24850, 1.25100, 1.25550
If the price fixes below 1.24500, expect the qutoes to fall toward 1.24200-1.24000.
Alternatively, the quotes can grow toward 1.25100-1.25400.
The USD/CAD currency pair
Technical indicators of the currency pair:
Prev Open: 1.30520
Open: 1.31179
% chg. over the last day: +0.56
Day’s range: 1.31126 – 1.31414
52 wk range: 1.2727 – 1.3664
There have been some aggressive purchases on the USD/CAD currency pair. Trading tool updated key extremes. At the moment, Looney is testing a local resistance of 1.31400. Mark 1.31150 is already a “mirror” support. USD/CAD can grow further. We recommend to pay attention to the dynamics of oil prices. Positions must be opened from key levels.
The Economic News Feed for 23.07.2019 is calm.
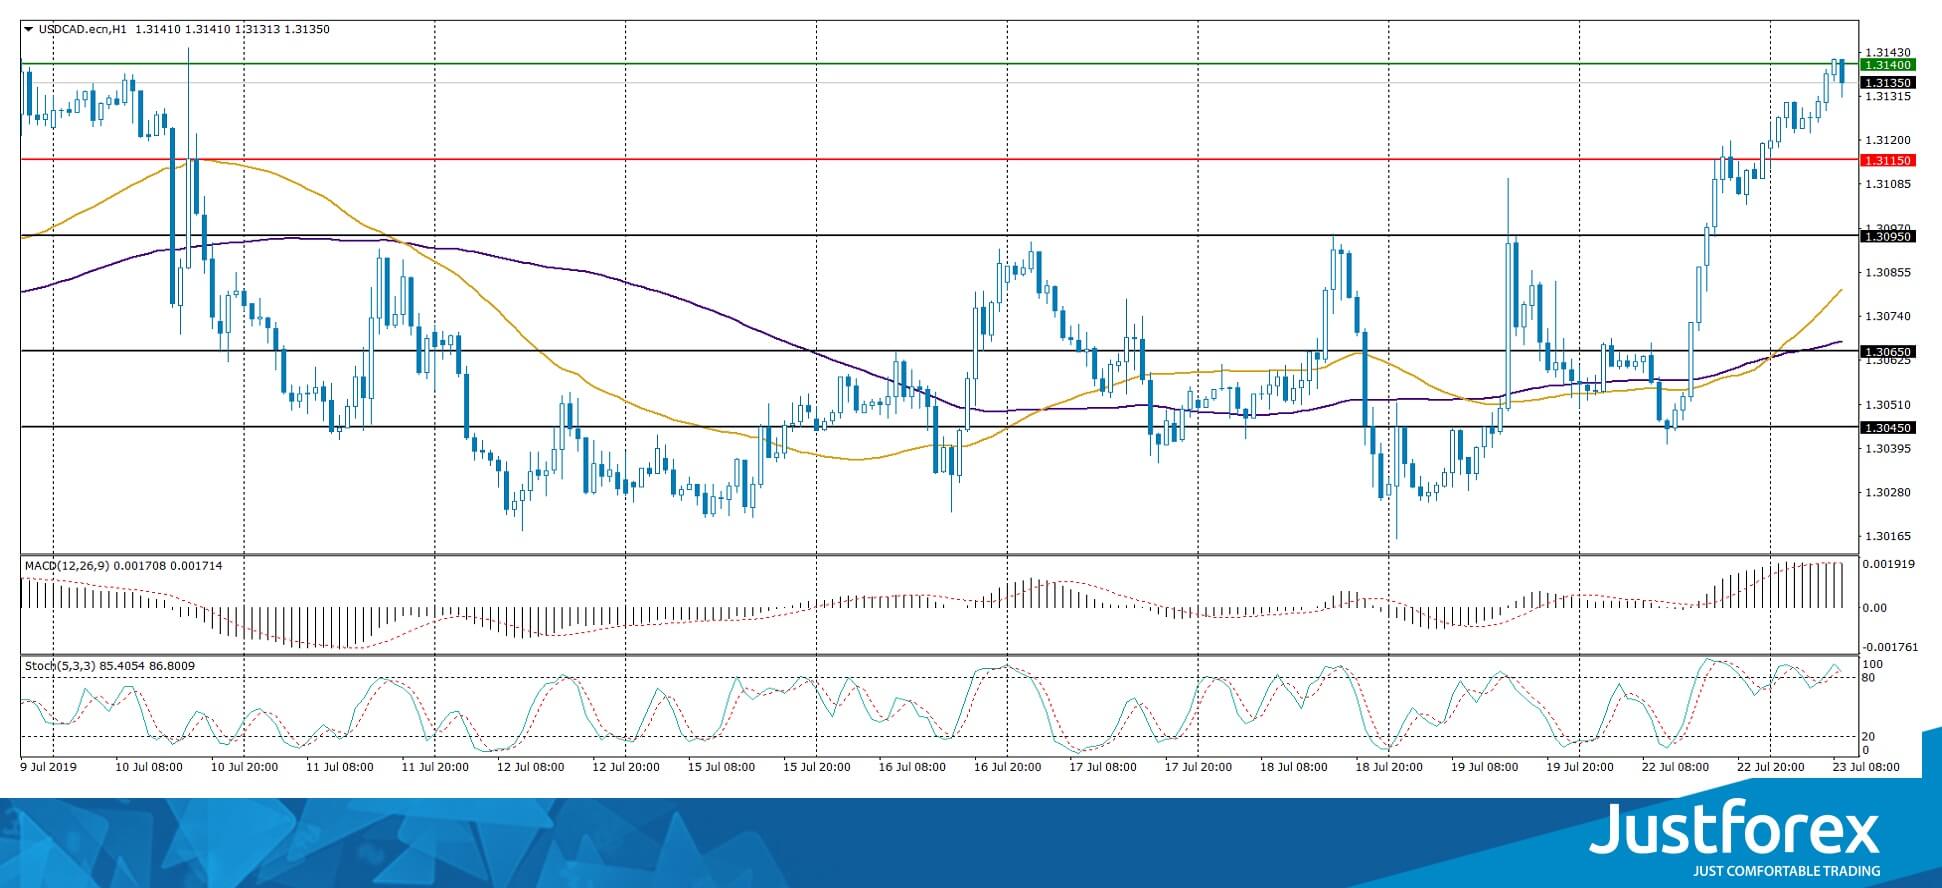
The price has fixed above 50 MA and 100 MA, which indicates the strength of buyers.
The MACD histogram is located in the positive zone and above the signal line, which gives a strong signal to buy USD/CAD.
Stochastic Oscillator is in the overbought zone, the %K line crossed the %D line. There are no signals at the moment.
Trading recommendations
Support levels: 1.31150, 1.30950, 1.30650
Resistance levels: 1.31400, 1.32000
If the price consolidates above 1.31400, expect further growth to 1.31800-1.32000.
Alternatively, the quotes canfakk toward 1.31000-1.30800.
The USD/JPY currency pair
Technical indicators of the currency pair:
Prev Open: 107.712
Open: 107.852
% chg. over the last day: +0.07
Day’s range: 107.826 – 108.193
52 wk range: 104.97 – 114.56
Buyers prevail on the USD/JPY. The trading instrument has updated local maximums. At the moment, the USD/JPY quotes are testing the supply zone of 108.200-108.350. The key support is 107.900. The currency pair can grow further. Pay attention to economic releases, as well as the US Treasury bond’s yield. Open positions from the key levels.
The Economic News Feed for 23.07.2019 is calm.
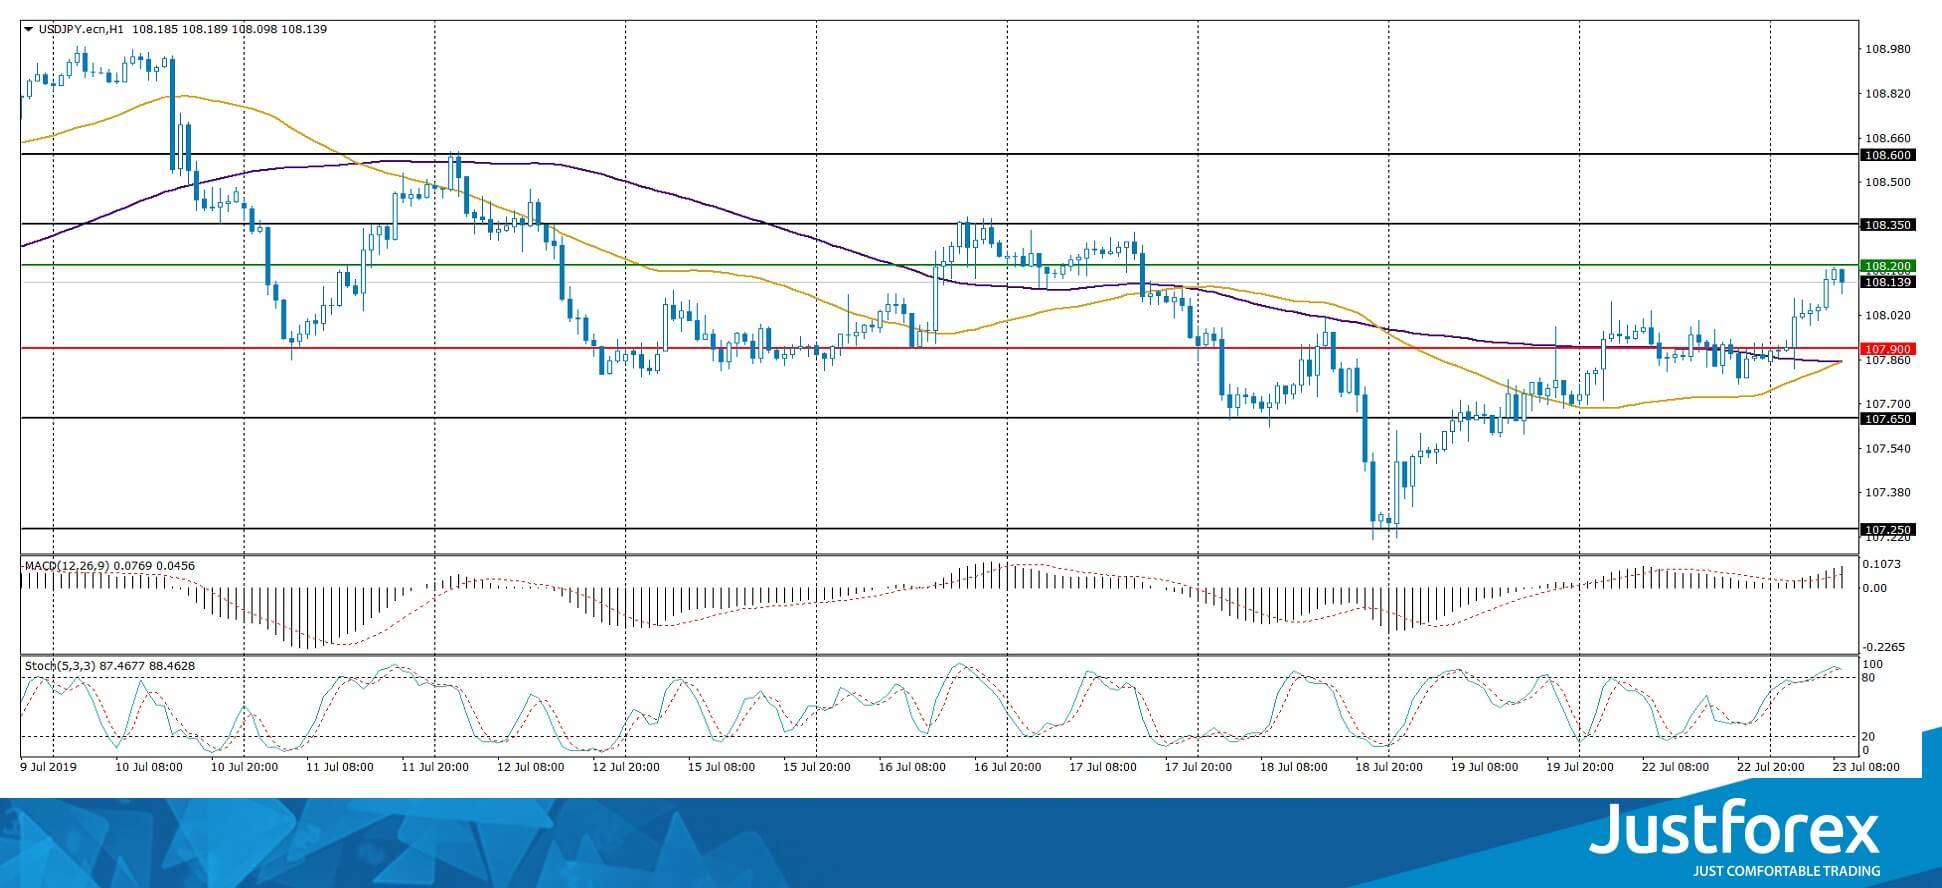
The indicators do not provide precise signals.
The MACD histogram is in the positive zone and above the signal line, which gives a signal to buy USD/JPY.
The Stochastic Oscillator is i the overbought zone, the %K line crossed the %D line. There are no singals.
Trading recommendations
Support levels: 107.900, 107.650, 107.250
Resistance levels: 108.200, 108.350, 108.600
If the price consolidates above the 108.200 mark, the quotes can grow toward 108.500-108.700.
Alternatively, the quotes can descend toward 107.700-107.500


