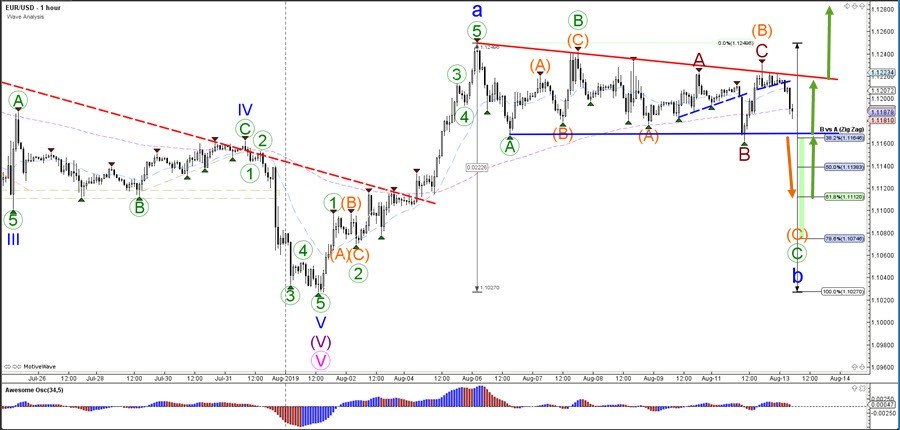
The EUR/USD is expected to make a bearish breakout first as part of a bearish ABC (orange) correction of a larger wave B (blue). Price is then likely to bounce at the 61.8% Fibonacci retracement level of wave B vs A for a larger bullish ABC. A break above the resistance trend lines (red) could, however, indicate an immediate bullish breakout instead.
The EUR/USD made a bearish bounce at the resistance trend line (red) of the triangle chart pattern yesterday. A break below the support trend line (blue) could indicate the end of the wave B (orange) and the start of the wave C (orange).