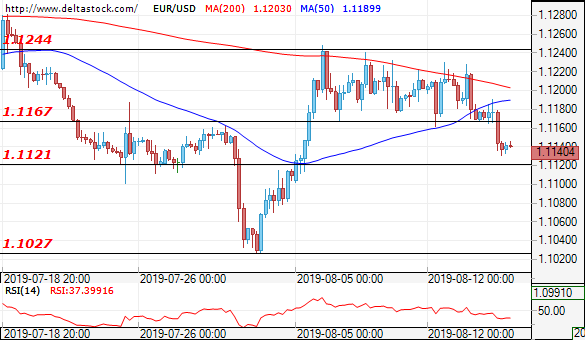
EUR/USD
Current level – 1.1140
Yesterday the pair successfully broke the lower border line of the range at 1.1167 which formed in the last few days. In the consolidation period it’s noticeable that bulls lose momentum rapidly at lower and lower prices and a continuation of the downtrend is possible. For the breach to be real it is preferable to see a test of the breach zone at 1.1167-1.1180. Upon successful confirmation, we can see another depreciation towards the recent low at 1.1026. If it turns out to be a faker, the possible scenario is for the price to go back into the range zone and the bulls to continue with their attempts to regain control.
| Resistance | Support | ||
| intraday | intraweek | intraday | intraweek |
| 1.1180 | 1.1300 | 1.1120 | 1.1020 |
| 1.1250 | 1.1300 | 1.1020 | 1.0960 |
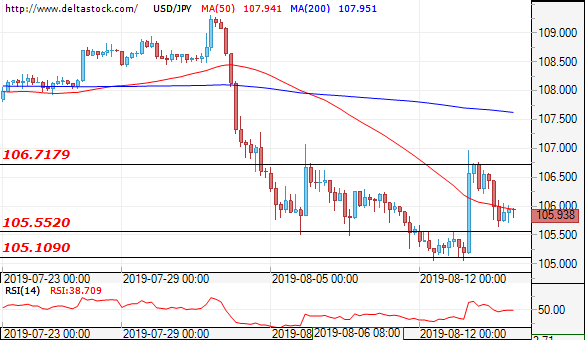
USD/JPY
Current level – 105.93
The interest towards safe haven assets and the Japanese yen as one of them keeps getting bigger in the aftermath of rising investor concerns regarding global recession risks. The rising impulse remained limited below the resistance at 106.70. It’s possible that trading continues in the range between 105.10-106.70 until investors don’t get more clarity whether the escalating trade conflict between the US and China can be resolved.
| Resistance | Support | ||
| intraday | intraweek | intraday | intraweek |
| 106.75 | 107.50 | 105.50 | 104.46 |
| 107.50 | 108.50 | 105.00 | 100.00 |
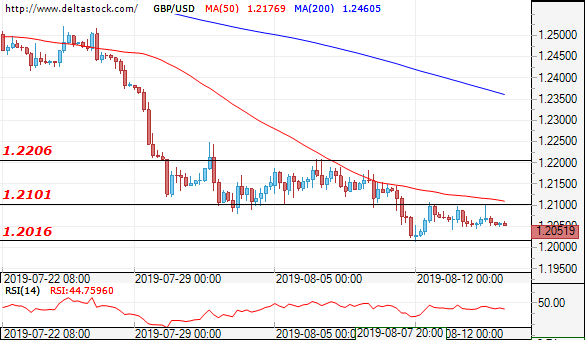
GBP/USD
Current level – 1.2051
After a few impulses of the price to return above 1.2100, we saw that each time the attack of the bulls got smacked down. Taking this into consideration, we can say the breach was successful and the bears won a bit more territory. The diminished price activity suggests the trade to continue in the range 1.2016-1.2200. For now sellers are in full control, however surprises and sharp price moves are still possible upon unexpected news and events. The general bias is bearish and it’s possible to witness new historic lows.
| Resistance | Support | ||
| intraday | intraweek | intraday | intraweek |
| 1.2100 | 1.2350 | 1.2014 | 1.1980 |
| 1.2200 | 1.2520 | 1.1980 | 1.1900 |