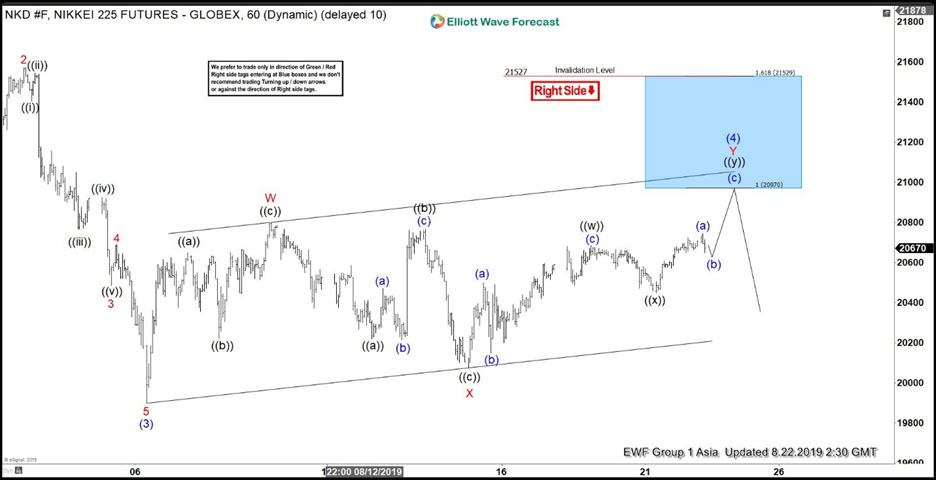
Short Term Elliott Wave View in Nikkei suggests the decline to 19900 on August 6 ended wave (3). The Index is currently in wave (4) bounce and the internal subdivision is unfolding as a double three Elliott Wave structure. Up from 19900, wave W ended at 20795 as a zigzag. Wave ((a)) of W ended at 20650 and wave ((b)) of W ended at 20220. Then the move higher to 20795 completed wave ((c)) of W.
The Index then pullback to 20075 which ended wave X with internal subdivision as a zigzag. Wave ((a)) of X ended at 20300, wave ((b)) of X ended at 20765, and wave ((c)) of X ended at 20075. Wave Y is in progress with the internal subdivision of a double three in lesser degree. Up from 20075, wave ((w)) ended at 20685 and wave ((x)) ended at 20450. Near term, while above 20075, Index has scope to extend higher towards 20970 – 21529 area to end wave Y of (4). Expect sellers to appear from the above area and Index to either resume lower or pullback in 3 waves at least. We don’t like buying the Index.
Nikkei 1 Hour Elliott Wave Chart