
The EUR/USD currency pair
Technical indicators of the currency pair:
Prev Open: 1.10566
Open: 1.09898
% chg. over the last day: -0.60
Day’s range: 1.09830 – 1.09857
52 wk range: 1.0963 – 1.1817
Aggressive sales were observed on Friday on the EUR/USD currency pair. The drop in quotes exceeded 75 points. The trading tool has updated the key lows. The euro came under pressure after the release of weak inflation data in the eurozone. Some experts believe that the ECB at the next meeting may signal the introduction of additional financial incentives. At the moment, EUR / USD quotes are consolidating in the range of 1.09650-1.10000. We recommend opening positions from these marks.
At 10:55 (GMT+3:00), Germany will publish the business activity index in the manufacturing industry.
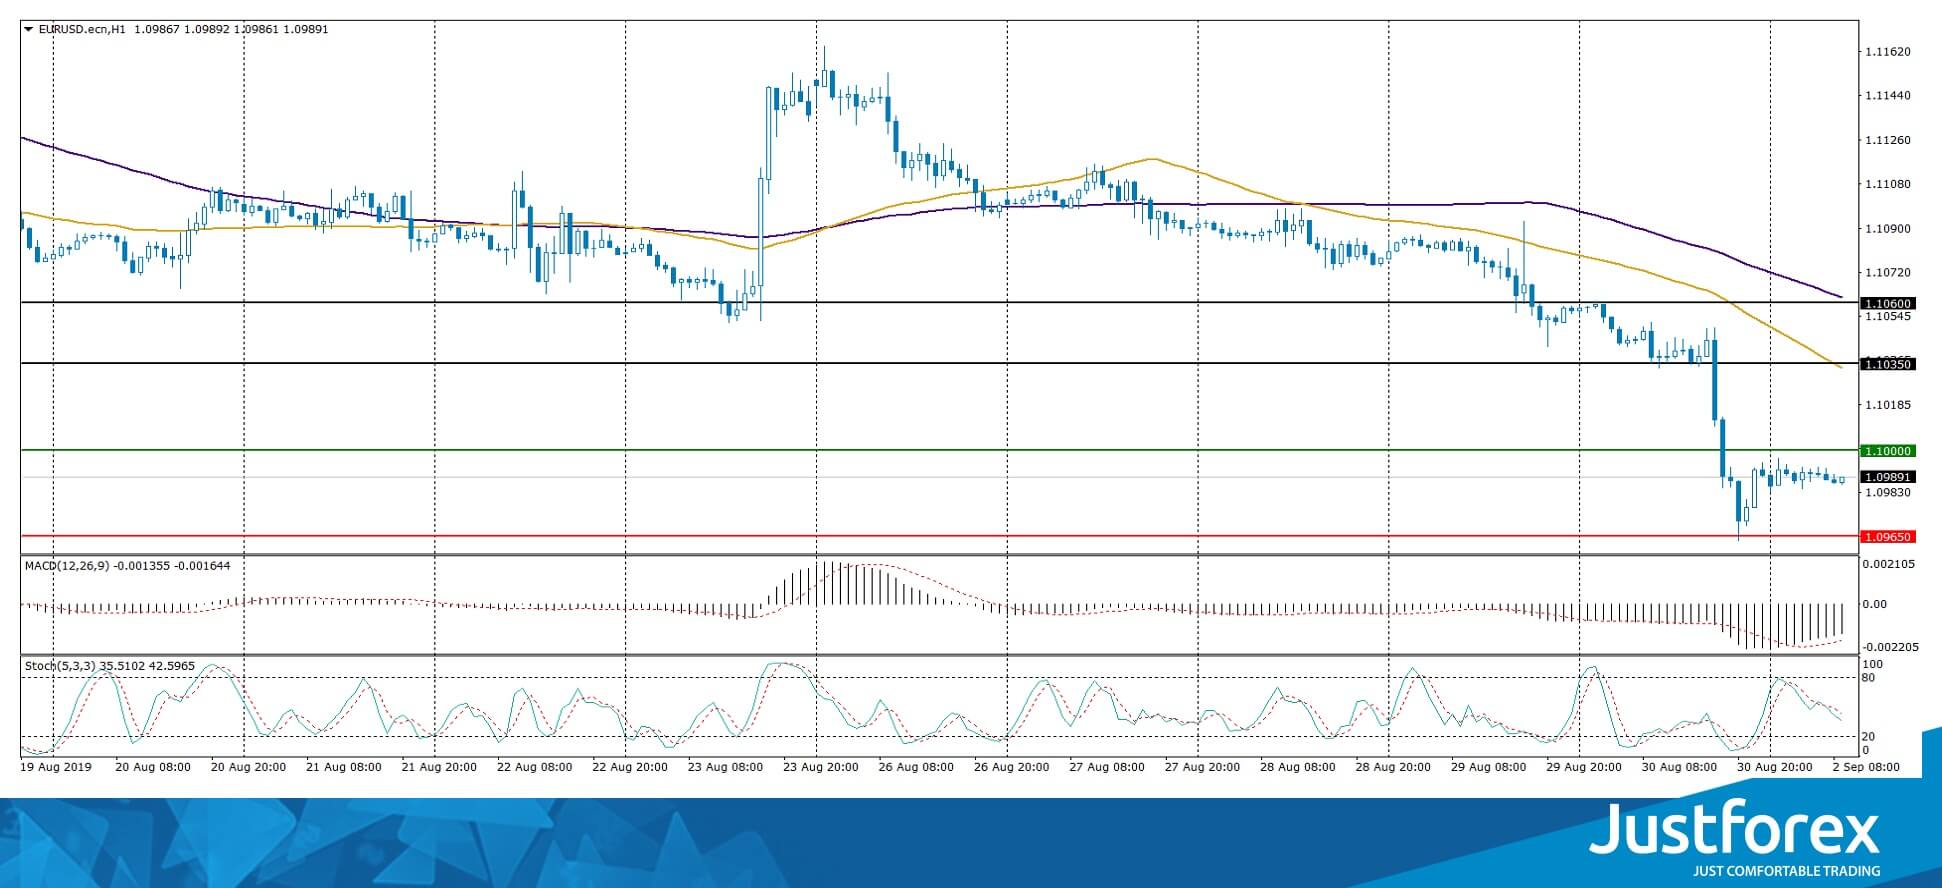
Indicators indicate the strength of sellers: the price has fixed below 50 MA and 100 MA.
The MACD histogram is in the negative zone but above the signal line, which gives a weak signal to sell EUR/USD.
The Stochastic Oscillator is in the neutral zone, the %K line is below the %D line, which also indicates a bearish sentiment.
Trading recommendations
Support levels: 1.09650, 1.09500
Resistance levels: 1.10000, 1.10350, 1.10600
If the price consolidates below 1.09650, expect a further drop toward 1.09400-1.09200.
Alternatively, the quotes could recover toward 1.10300-1.10500.
The GBP/USD currency pair
Technical indicators of the currency pair:
Prev Open: 1.22049
Open: 1.21803
% chg. over the last day: -0.23
Day’s range: 1.21747 – 1.21918
52 wk range: 1.2015 – 1.3385
The GBP/USD currency pair stabilized after a sharp decline since the beginning of this week. GBP is currently consolidating. There is no defined trend. The key support and resistance levels are 1.21600 and 1.22000, respectively. Investors expect up-to-date information regarding the Brexit process. Today we recommend paying attention to statistics from the United States. Positions must be opened from these levels.
The Economic News Feed for 02.09.2019 is calm.
Economic Event (GB) – 00:00 (GMT+3:00);
Economic Event (GB) – 00:00 (GMT+3:00);
Economic Event (GB) – 00:00 (GMT+3:00);
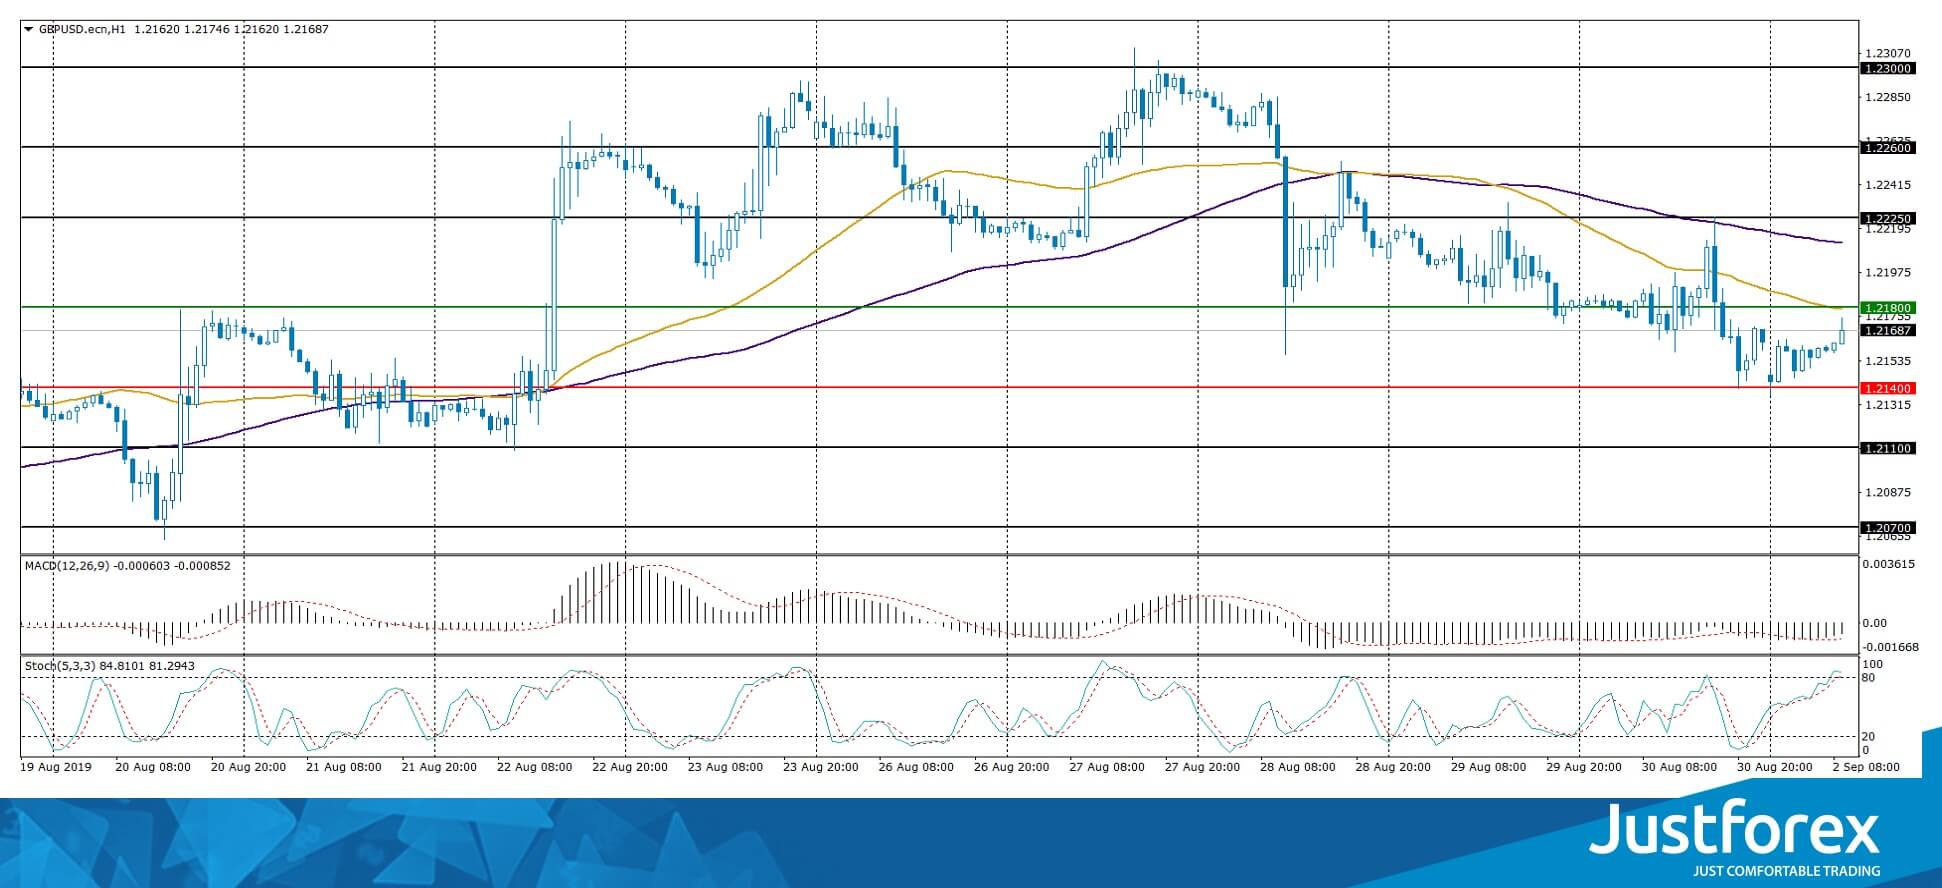
The price fixed below 50 MA and 100 MA, which signals the strength of sellers
The MACD histogram is in the negative zone, but above the signal line, which gives a weak signal to sell GBP/USD.
Stochastic Oscillator is in the neutral zone, the %K line is above the %D line, which indicates bullish sentiment.
Trading recommendations
Support levels: 1.21600, 1.21100, 1.20700
Resistance levels: 1.22000, 1.22500, 1.23000
If the price consolidates above the round level of 1.22000, expect the quotes to rise toward 1.22400-1.22600.
Alternatively, the quotes could decrease toward 1.21300-1.21100.
The USD/CAD currency pair
Technical indicators of the currency pair:
Prev Open: 1.32897
Open: 1.33128
% chg. over the last day: +0.20
Day’s range: 1.33128 – 1.33251
52 wk range: 1.2727 – 1.3664
The technical picture on the USD/CAD currency pair is still ambiguous. Unidirectional trends are not observed. CAD is currently consolidating near a local resistance of 1.33250. The round level 1.33000 is the immediate support. USD/CAD quotes have upside potential. We recommend that you pay attention to the dynamics of oil prices. Positions must be opened from key levels.
The Canada’s financial markets are closed today due to the holiday.
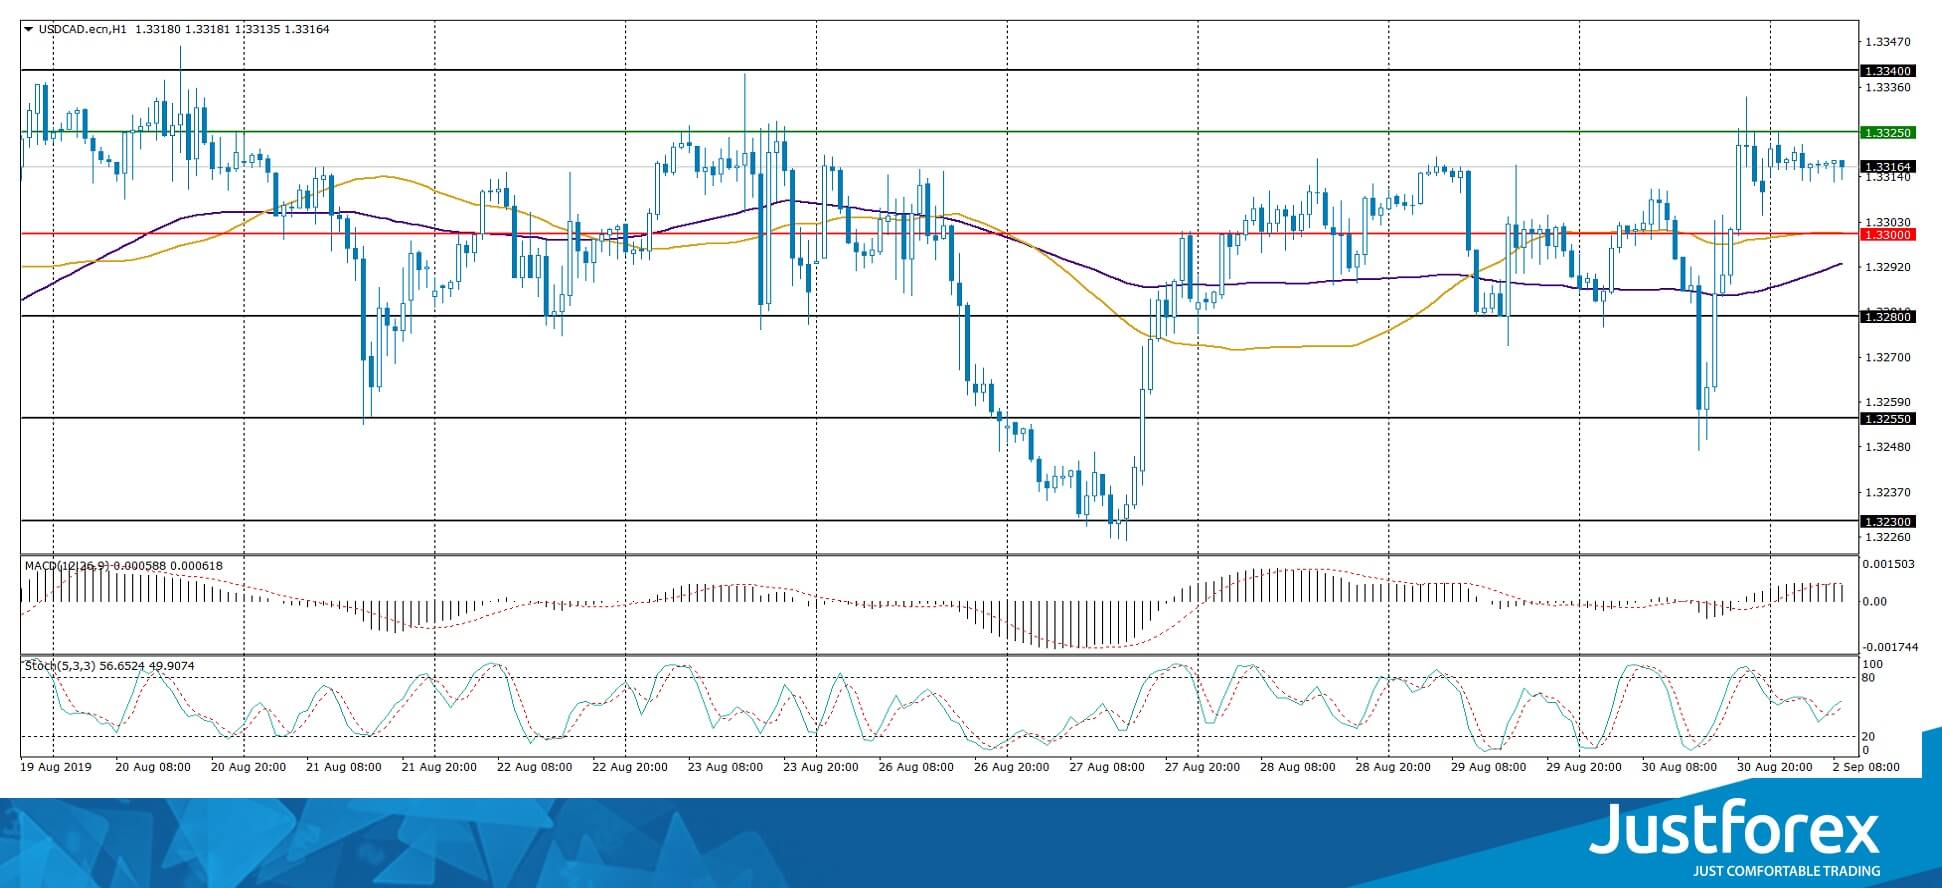
The price fixed above 50 MA and 100 MA, which signals the strength of buyers.
The MACD histogram is in the positive zone, which also gives a signal to buy USD / CAD.
The Stochastic Oscillator is in the neutral zone, the %K line is above the %D line, which indicates bullish sentiment.
Trading recommendations
Support levels: 1.33000, 1.32800, 1.32550
Resistance levels: 1.33250, 1.33400
If the price consolidates above 1.33250, expect the quotes to grow toward 1.33400-1.33600.
Alternatively, the quotes could drop toward 1.32800-1.32650.
The USD/JPY currency pair
Technical indicators of the currency pair:
Prev Open: 106.517
Open: 106.048
% chg. over the last day: -0.20
Day’s range: 105.920 – 106.242
52 wk range: 104.97 – 114.56
The USD/JPY currency pair stabilized after the rally last week. The trading instrument is currently consolidating. The key support and resistance levels are: 105.850 and 106.300, respectively. Financial market participants continue to monitor the trade conflict between Washington and Beijing. We also recommend paying attention to the dynamics of yield on US government bonds. USD/JPY quotes have the potential for further growth. Positions must be opened from key levels.
The Economic News Feed for 02.09.2019 is calm.
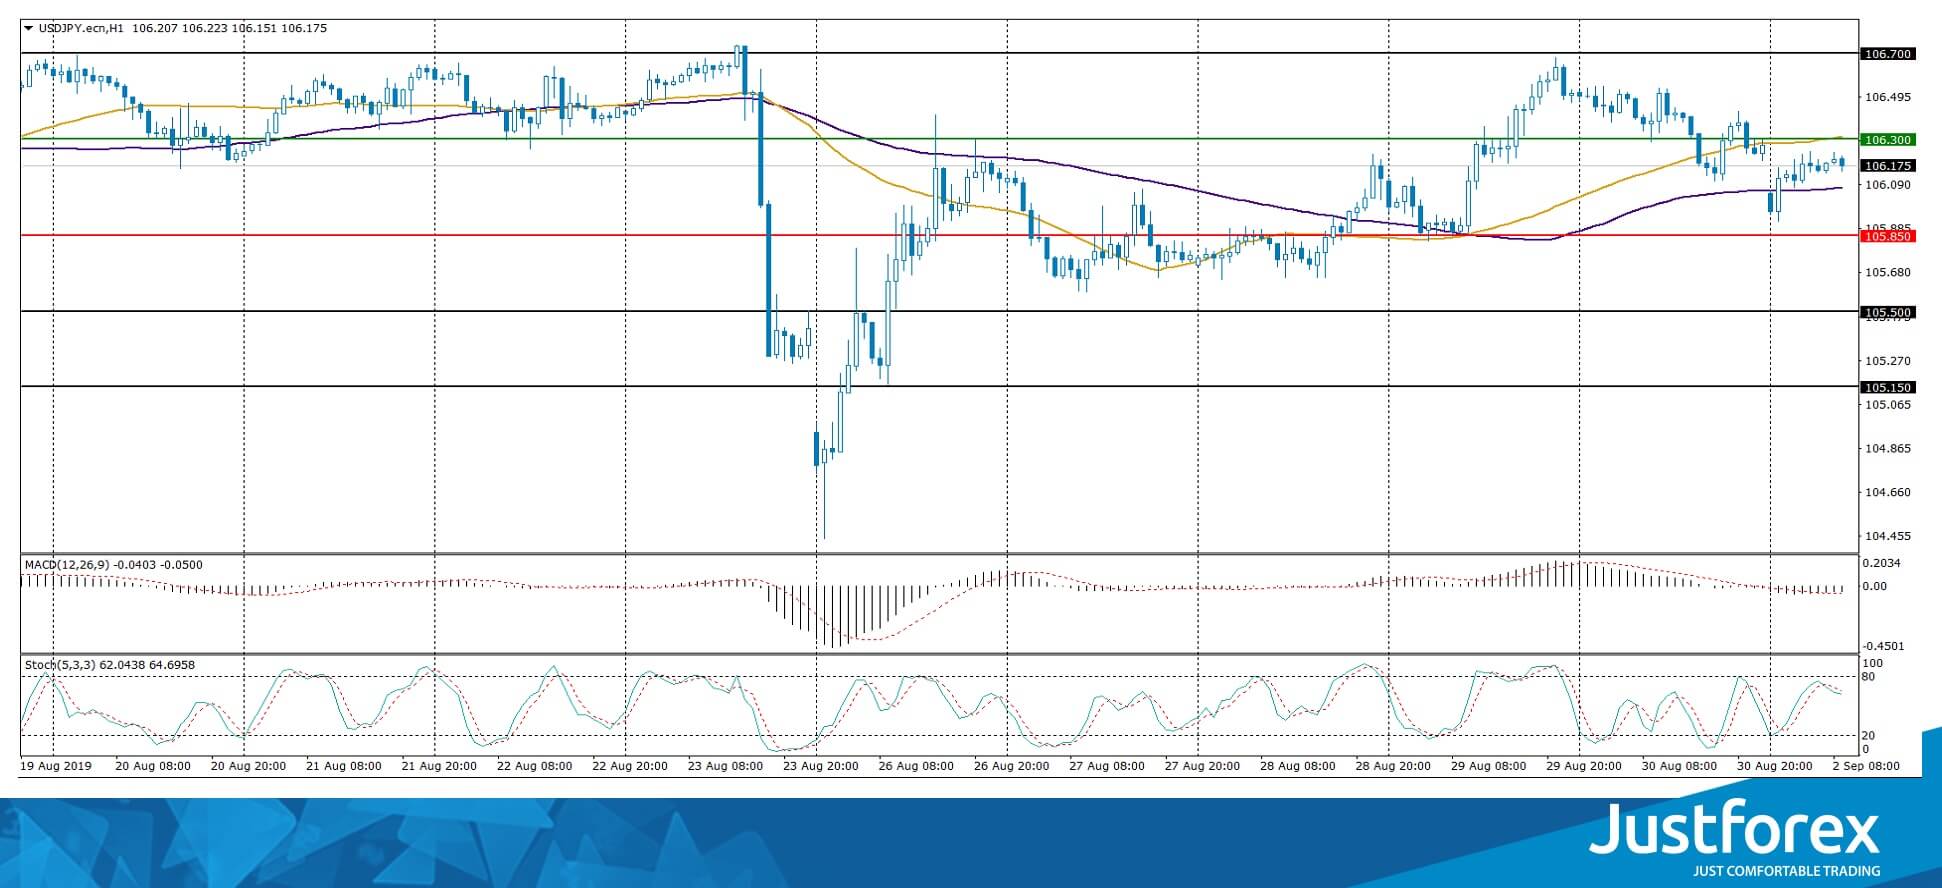
Indicators do not give accurate signals: the price crossed 50 MA and 100 MA.
The MACD histogram is near 0. There are no signals at the moment.
The Stochastic Oscillator is in the neutral zone, the %K line is below the %D line, which indicates a bearish sentiment.
Trading recommendations
Support levels: 105.850, 105.500, 105.150
Resistance levels: 106.300, 106.700, 107.000
If the price consolidates above 106.300, expect further growth toward 106.600-106.850.
Alternatively, the quotes could drop toward 105.600-105.450.


