
Key Highlights
- Crude oil price failed to surpass the key resistance near $57.00 against the US dollar.
- XTI/USD traded below a major bullish trend line with support at $54.75 on the 4-hours chart.
- GBP/USD spiked below the 1.2000 support and EUR/USD fell below 1.0950.
- The US ISM Manufacturing Index declined sharply from 51.2 to 49.1 in August 2019.
Crude Oil Price Technical Analysis
This past week, crude oil price made another attempt to surpass the key $57.00 resistance against the US Dollar. However, the price failed to continue higher and started a strong decline below the $55.50 support.
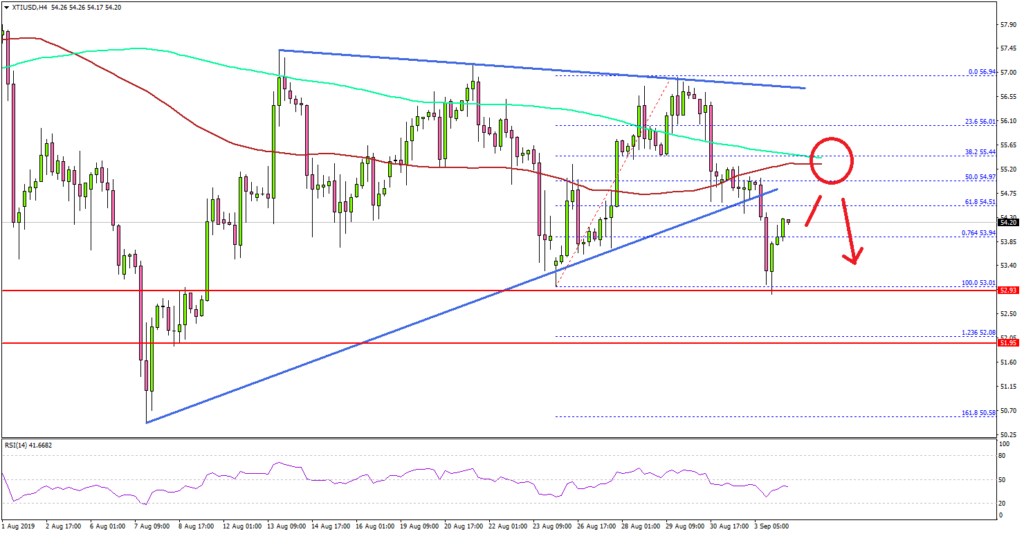
Looking at the 4-hours chart of XTI/USD, the price topped at $56.94 and recently traded below the $56.00, $55.50 and $50.00 support levels. Moreover, there was a close below the $55.00 support plus the 100 (red) simple moving average (4-hours).
The price also traded below a major bullish trend line with support at $54.75 on the same chart. Finally, there was a break below the 61.8% Fib retracement level of the upward move from the $53.01 low to $56.94 high.
On the downside, an immediate support is near the $53.00 swing low. If the price extends its decline, it could test the $52.00 support or the 1.236 Fib extension level of the upward move from the $53.01 low to $56.94 high.
On the upside, the previous support near $55.00 and $55.50 are likely to prevent an upward move along with the 100 SMA. The main resistance is still near the $57.00 area, above which the price could gain bullish momentum towards $58.50 and $60.00.
Fundamentally, the US ISM Manufacturing Index for August 2019 was released by the Institute for Supply Management (ISM). The market was looking for a minor decline in the index from 51.2 to 51.0.
However, the actual result very disappointing, as the US ISM Manufacturing Index declined sharply from 51.2 to 49.1 and posted contraction.
The report highlighted that:
New orders, production, and employment contracting. Supplier deliveries slowing at a slower rate; backlog contracting. Raw materials inventories contracting; customers’ inventories too low. Prices decreasing; exports and imports contracting.
Looking at major pairs, EUR/USD extended its decline below the 1.0950 level, and GBP/USD spiked below the crucial 1.2000 support area. However, both pairs started a decent recovery after disappointing ISM report.
Economic Releases to Watch Today
- Germany’s Services PMI for August 2019 – Forecast 54.4, versus 54.4 previous.
- Euro Zone Services PMI for August 2019 – Forecast 53.4, versus 53.4 previous.
- UK Services PMI for August 2019 – Forecast 51.0, versus 51.4 previous.
- US Trade Balance for July 2019 – Forecast $-53.5B, versus $-55.2B previous.
- BoC Interest Rate Decision – Forecast 1.75%, versus 1.75% previous.


