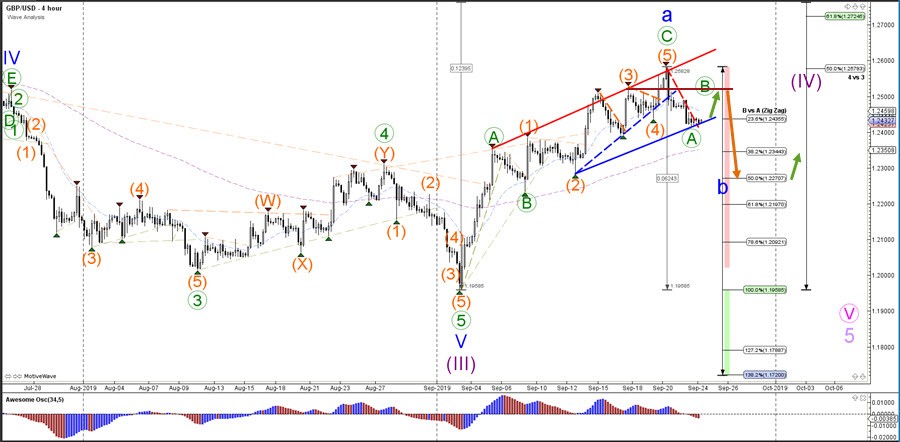
The GBP/USD uptrend lasted more than 600 pips but eventually ran out of steam after completing a bullish ABC (green) correction. The final 50% Fibonacci resistance zone stopped the bulls and created an impulsive bearish decline, which took the price down to the 23.6% Fibonacci retracement level around 1.24. This support level could create a bullish bounce and the expected wave B (green) before a larger decline takes price lower.
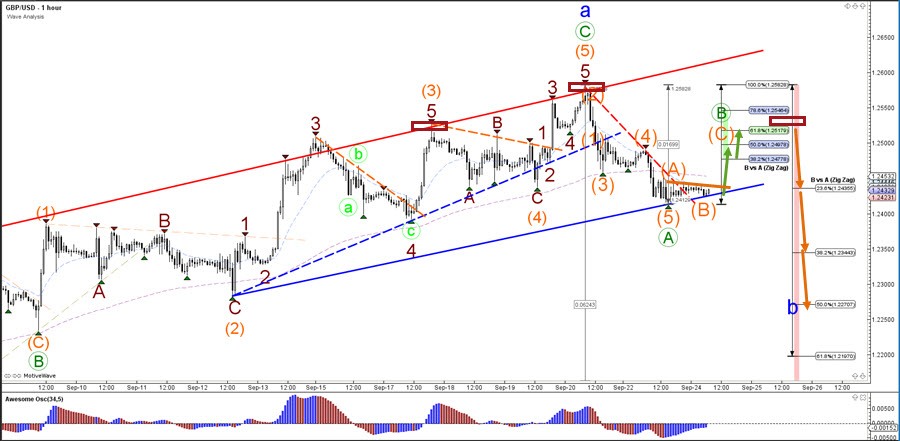
The GBP/USD seems to have completed 5 waves (orange) of wave A (green), which indicates that more bearishness can be expected after price completes an ABC (orange) in wave B (green). Besides the 61.8% Fibonacci retracement, the Cable could also struggle with the head and shoulders resistance level (dark red boxes). A bullish breakout above the resistance line (orange) could indicate a wave C (orange) whereas a bearish bounce could indicate a larger bearish ABC pattern.