
Key Highlights
- The British Pound rebounded after it found support near 1.2200 against the US Dollar.
- A key bearish trend line is forming with resistance near 1.2375 on the 4-hours chart of GBP/USD.
- The UK Halifax House Price Index declined 0.4% in Sep 2019 (MoM), whereas the forecast was +0.1%.
- The US Producer Price Index could increase 0.1% in Sep 2019 (MoM).
GBP/USD Technical Analysis
This past week, the British Pound declined below the 1.2400 and 1.2300 supports against the US Dollar. However, GBP/USD found support near 1.2200 and recently started an upside correction.
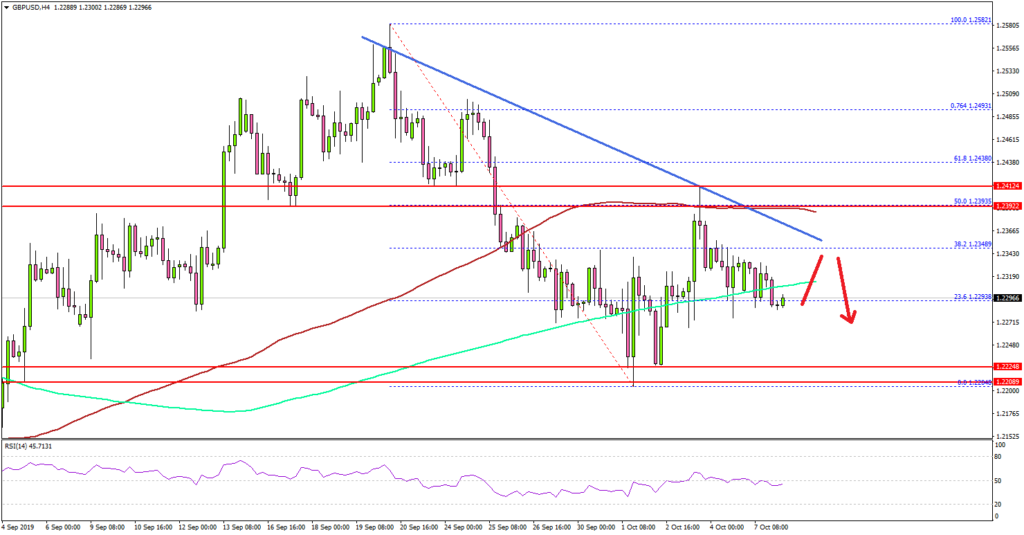
Looking at the 4-hours chart, the pair traded as low as 1.2204 and rebounded above the 1.2300 resistance. There was a break above the 1.2320 resistance and the 200 simple moving average (green, 4-hours).
However, the upward move was capped by the 1.2400 resistance area. Additionally, the 50% Fib retracement level of the last key decline from the 1.2582 high to 1.2204 low acted as a resistance.
There is also a key bearish trend line forming with resistance near 1.2375 on the same chart. Besides, the 100 simple moving average (red, 4-hours) is currently positioned near the 1.2390 level.
Therefore, a clear break above the 1.2375 and 1.2400 resistance levels is must for a fresh increase towards the 1.2400 level. Conversely, if the pair struggles to surpass the 1.2400 resistance area, it could resume its decline.
The main support on the downside is near the 1.2200 level. If there is a bearish break below the 1.2200 support, the pair could extend its decline towards the 1.2140 level.
Fundamentally, the UK Halifax House Price Index for Sep 2019 was released by the HBOS. The market was looking for the index to increase 0.1% compared with the previous month.
The actual result was disappointing, as the Halifax House Price Index declined 0.4%. Moreover, the last reading was revised down from +0.3% to +0.2%.
The report added:
In the latest quarter (July to September) house prices were 0.4% higher than in the preceding three months (April to June).
Overall, GBP/USD might struggle to surpass the 1.2375 and 1.2400 resistance levels. Looking at EUR/USD, the pair is also facing key hurdles near 1.1020 and 1.1050.
Upcoming Economic Releases
- US Producer Price Index Sep 2019 (MoM) – Forecast +0.1%, versus +0.1% previous.
- US Producer Price Index Sep 2019 (YoY) – Forecast +1.8%, versus +1.8% previous.


