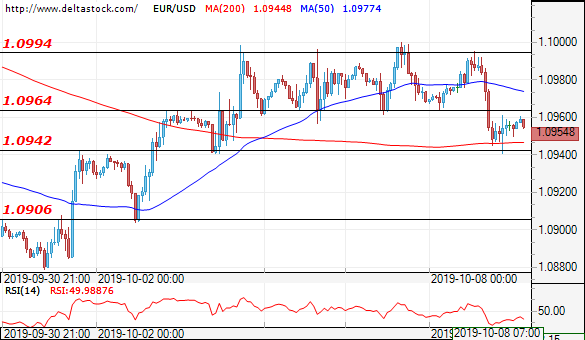
EUR/USD
Current level – 1.0954
The EUR/USD slipped as the negative tension on the markets rised around Brexit and the US-China trade war. The currency pair hit the support level at 1.0942, where a breach could easy pave the way to the next target at 1.0906. This would confirm the downtrend and lead the EUR/USD to hit lower zones. If the support successfully hold, the buyers could push upward to the minor resistance level at 1.0964 and to test bringing up the price again in the range with upper border and resistance level 1.0994
| Resistance | Support | ||
| intraday | intraweek | intraday | intraweek |
| 1.1000 | 1.1176 | 1.0945 | 1.0880 |
| 1.1070 | 1.1176 | 1.0940 | 1.0830 |
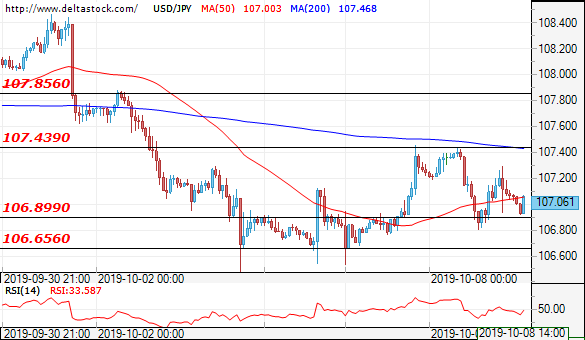
USD/JPY
Current level – 107.06
The test of the resistance at 107.439 was not successful and the bears took control with a downward push which led USD/JPY to hit the support zone at 106.89. The negative sentiments around the acceleration of the US-China trade war helped, but were not enough to breach the zone and test the next target at 106.65. A drop to that level could lead to hitting new lows and renew the negative trend for the US dollar. An alternative scenario could be a new test of the resistance zone at 107.43 and potentially the next level at 107.85.
| Resistance | Support | ||
| intraday | intraweek | intraday | intraweek |
| 107.67 | 108.20 | 107.00 | 106.40 |
| 107.88 | 108.80 | 106.68 | 105.80 |
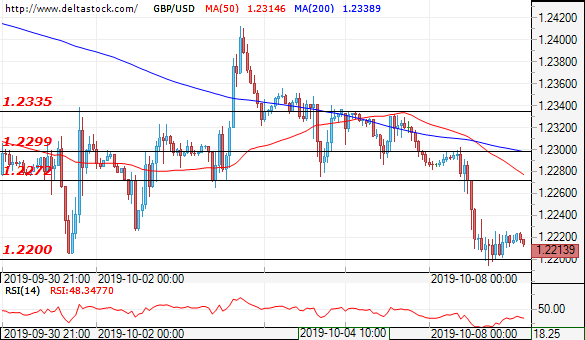
GBP/USD
Current level – 1.2213
The disappointing news about a potential hard brexit after the talks between the German Chancellor Angela Merkel and British Prime Minister Boris Johnson slid down the GBP/USD and breached the previously formed support at 1.2272. The pair found support around the levels from the end of August at 1.2198, but with the negative sentiments remaining, the pair could push through this level and pave the way to the next support at 1.2180, hitting new lows. On the upside, a retracement and breakthrough to the transformed already as a resistance zone at 1.2272 could lead to a rise to the next targets at 1.2300 and 1.2335.
| Resistance | Support | ||
| intraday | intraweek | intraday | intraweek |
| 1.2340 | 1.2500 | 1.2180 | 1.2100 |
| 1.2420 | 1.2550 | 1.1700 | 1.2000 |