
Key Highlights
- Gold price is trading below a major hurdle near $1,500 against the US Dollar.
- There is a crucial bearish trend line forming with resistance near $1,500 on the 4-hours chart of XAU/USD.
- The US Retail Sales declined 0.3% in Sep 2019 (MoM), whereas the forecast was +0.3%.
- The US Industrial Production could decline 0.1% in Sep 2019 (MoM), whereas the last was +0.6%.
Gold Price Technical Analysis
This past week, gold price declined from the $1,517 swing high and tested $1,475 against the US Dollar. This week, the price revisited the $1,475 support and it is currently facing a strong resistance.
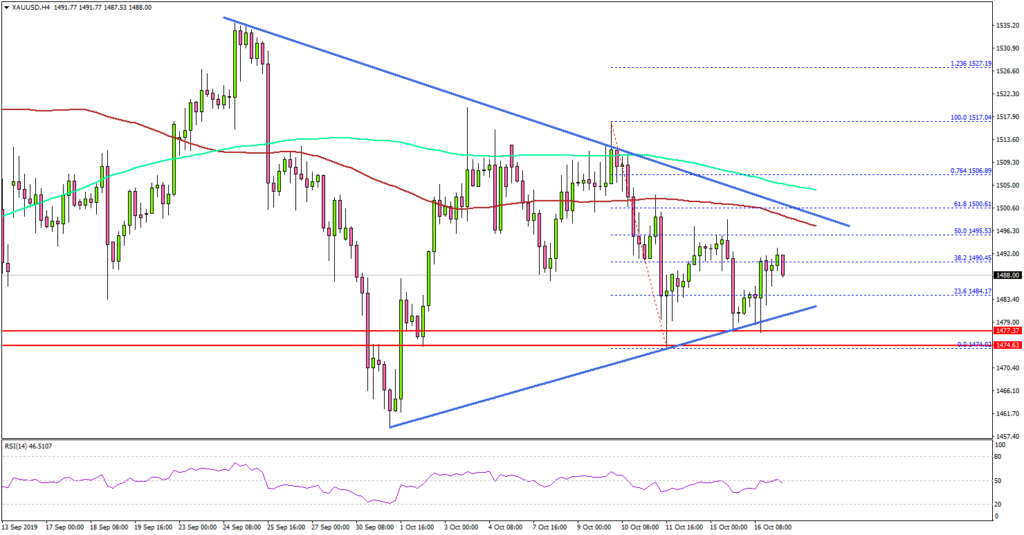
The 4-hours chart of XAU/USD indicates that the price settled below the $1,500 pivot level and the 100 simple moving average (4-hours, red). However, the $1,475 area acted as a strong support on a couple of occasions.
Therefore, a downside break below the $1,475 support area might push the price further lower. The next major support area is near the $1,462 and $1,460 levels.
On the upside, there is a significant resistance forming near $1,500, the 100 SMA, and the 50% Fib retracement level of the downward move from the $1,517 high to $1,474 low.
More importantly, there is a crucial bearish trend line forming with resistance near $1,500 on the 4-hours chart of XAU/USD. Therefore, a successful break above the $1,500 resistance may perhaps open the doors for a fresh increase towards the $1,515 and $1,520 resistance levels.
Fundamentally, the US Retails Sales report for Sep 2019 was released by the US Census Bureau. The market was looking for a 0.3% rise in sales compared with the previous month.
The actual result was disappointing, as there was a 0.3% decline in sales in Sep 2019. Looking at the yearly change, there was a 4.1% rise in sales, up 0.7% from Sep 2018.
The report added:
Total sales for the July 2019 through September 2019 period were up 4.0 percent (±0.5 percent) from the same period a year ago. The July 2019 to August 2019 percent change was revised from up 0.4 percent (±0.5 percent)* to up 0.6 percent (±0.2 percent).
Looking at EUR/USD, the pair managed to stay above the 1.1000 support area, while GBP/USD rallied once again and climbed above the 1.2700 resistance (as discussed in one of the recent analyses).
Economic Releases to Watch Today
- UK Retail Sales for Sep 2019 (YoY) – Forecast +3.2%, versus +2.7% previous.
- UK Retail Sales for Sep 2019 (MoM) – Forecast 0%, versus -0.2% previous.
- US Initial Jobless Claims – Forecast 215K, versus 210K previous.
- US Industrial Production for Sep 2019 (MoM) – Forecast -0.1%, versus +0.6% previous.


