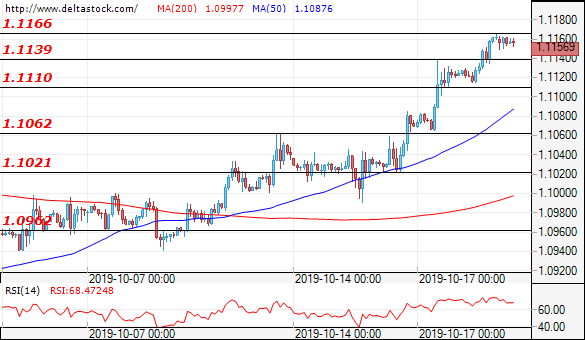
EUR/USD
Current level – 1.1157
The EUR/USD consolidated under the resistance zone around 1.1166, while market participants await a new dose of news around Brexit. A breach of this level would easily boost positive sentiment and lead the currency pair towards the highs from August at around 1.1240. On the other hand, if bears regain control they could push the price towards the minor support at 1.1139. If the aforementioned is broken, the next support levels lie at 1.1108 and 1.1062.
| Resistance | Support | ||
| intraday | intraweek | intraday | intraweek |
| 1.1170 | 1.1240 | 1.1108 | 1.0939 |
| 1.1200 | 1.1270 | 1.1062 | 1.0880 |
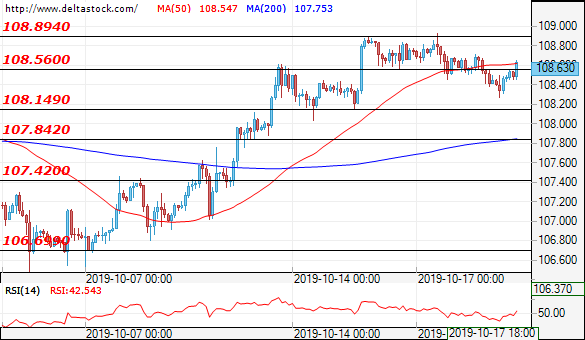
USD/JPY
Current level – 108.63
Buyers were not able to muster enough strength to push the price over the resistance zone at 108.94 as positive momentum seems to be fading. Despite breaking through the minor support at 108.56, sentiment remains positive. 108.15, followed by 107.84, remain major levels of support if demand for safe haven assets increases due to an increase in global geopolitical and macroeconomic risks. Alternatively, a breach of the previously hit resistance level at 108.93 could head the USD/JPY to the next target heights around 109.70.
| Resistance | Support | ||
| intraday | intraweek | intraday | intraweek |
| 109.00 | 109.00 | 108.11 | 107.40 |
| 109.20 | 109.30 | 107.90 | 107.00 |
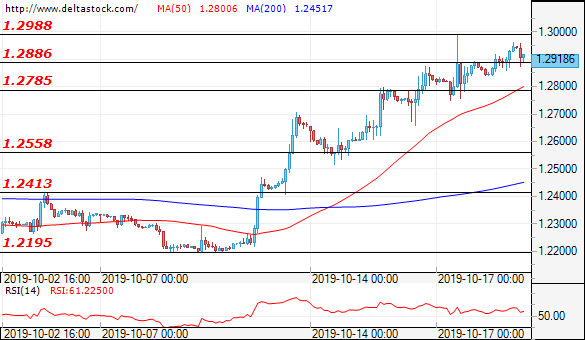
GBP/USD
Current level – 1.2918
After one of the most anticipated events this year – the Brexit deal vote – was delayed, the sterling lost some ground, but the decline was stopped by the 1.2888 support. Despite that, optimism lingers as Borris Johnson might push for a vote as early as today. A breakthrough here could push the price towards the next supports at 1.2785, followed by 1.2558. Again, as will be the case throughout this week, traders will focus on the news around the historical vote and any positive news should lead the Cable towards and above 1.3000.
| Resistance | Support | ||
| intraday | intraweek | intraday | intraweek |
| 1.3000 | 1.2890 | 1.2970 | 1.2345 |
| 1.3046 | 1.2970 | 1.2500 | 1.2200 |