
Key Highlights
- The US Dollar failed to stay above the 109.00 resistance and declined against the Japanese Yen.
- USD/JPY traded below a crucial bullish trend line with support near 108.80 on the 4-hours chart.
- The US Initial Jobless Claims for the week ending Oct 26, 2019 increased from 213K to 218K.
- The US nonfarm payrolls could increase 89K in Oct 2019, down from the last 136K.
USD/JPY Technical Analysis
This week, the US Dollar climbed above the 108.80 resistance area against the Japanese Yen. However, USD/JPY failed to hold gains above 109.00 and started a fresh decrease.
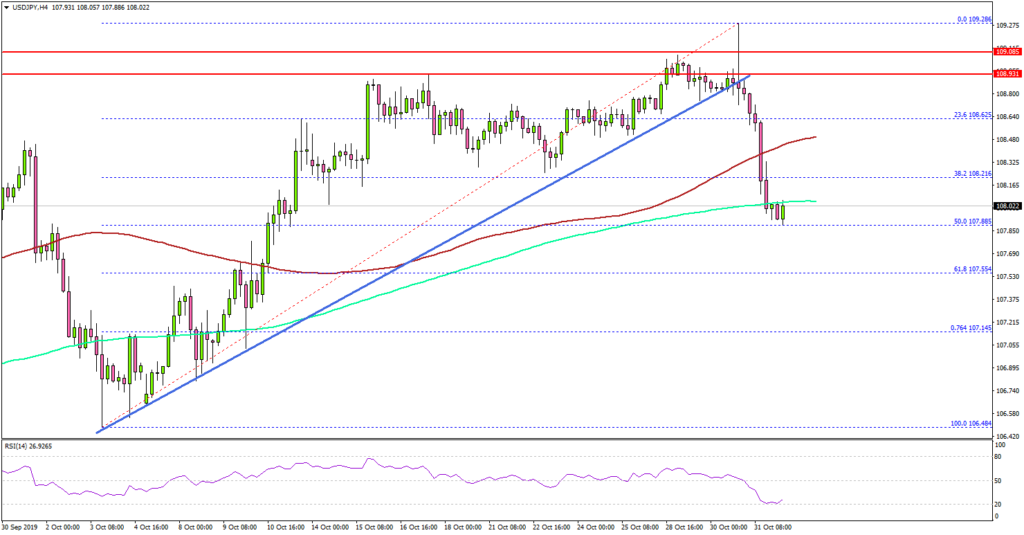
Looking at the 4-hours chart, the pair topped near the 109.28 and recently started a sharp decline. There was a sharp downward move below the 109.00 and 108.80 levels.
More importantly, the pair traded below a crucial bullish trend line with support near 108.80. Besides, the pair settled below the 108.50 support, the 100 simple moving average (red, 4-hours), and the 200 simple moving average (green, 4-hours).
It opened the doors for more losses and the pair tested the 50% Fib retracement level of the upward move from the 106.48 low to 109.28 high. At the moment, the 107.80 support area is protecting losses.
If there are more downsides, the pair could decline further towards the 107.50 and 107.20 support levels. The next major support is 107.15 or the 76.4% Fib retracement level of the upward move from the 106.48 low to 109.28 high.
On the upside, the previous support levels near the 108.50 area are likely to act as hurdles and prevent a fresh increase in the near term.
Fundamentally, the US Initial Jobless Claims for the week ending Oct 26, 2019 was released by the US Department of Labor. The market was looking for an increase in claims from 212K to 215K.
However, the actual result was slightly disappointing, as there was an increase to 218K in claims. Besides, the last reading was revised up from 212K to 213K.
The report added:
The 4-week moving average was 214,750, a decrease of 500 from the previous week’s revised average. The previous week’s average was revised up by 250 from 215,000to 215,250.
Overall, USD/JPY is showing bearish signs and there is a risk of more losses below the 107.80 support area in the coming sessions. Conversely, EUR/USD and GBP/USD are gaining momentum and likely to continue higher.
Upcoming Economic Releases
- US nonfarm payrolls Oct 2019 – Forecast 89K, versus 136K previous.
- US Unemployment Rate Oct 2019 – Forecast 3.6%, versus 3.5% previous.
- US ISM Manufacturing Index for Oct 2019 – Forecast 48.9, versus 47.8 previous.


