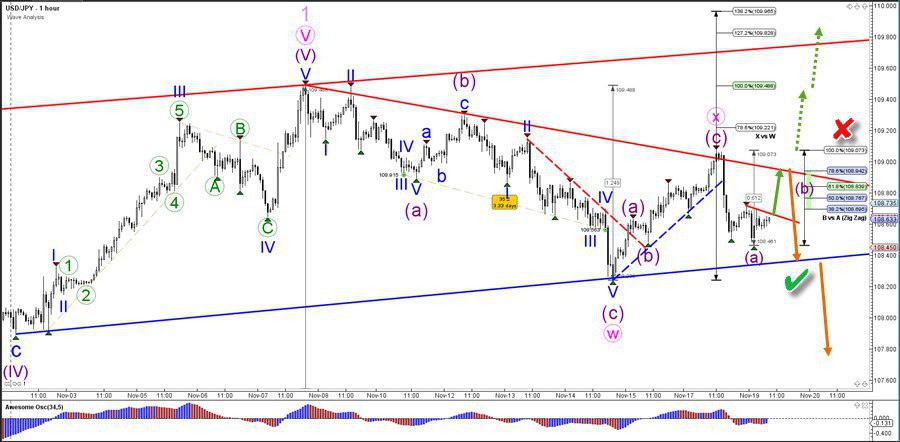
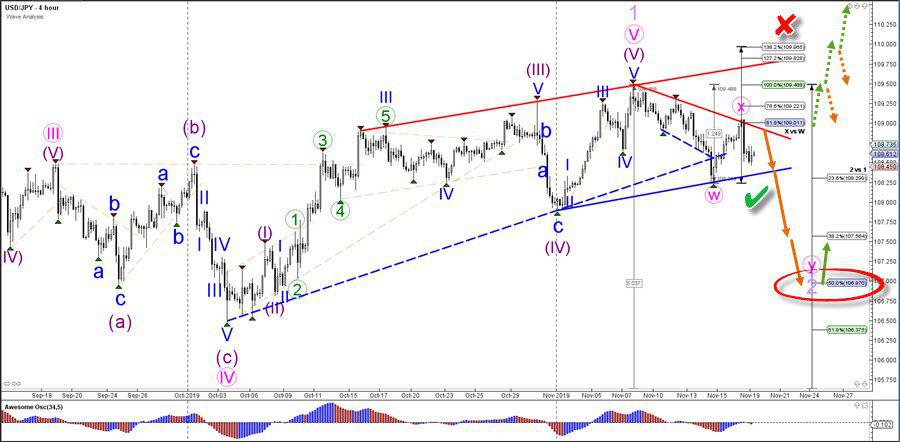
The USD/JPY has been showing increased volatile and choppy price action after it came close to hitting the round resistance level of 110. The rising wedge pattern in the middle of the chart suggests that a wave 5 (pink) of wave 1 (light purple) has been completed and that the current pattern is part of a bearish retracement. A break below support (blue) could confirm (green check) the extended and complex WXY (pink) correction towards the Fibonacci levels of wave 2 vs 1.
The USD/JPY is probably building a bearish ABC (purple) zigzag pattern as long as the price stays below the 100% Fibonacci level (red x). A break above that 100% Fib could indicate a larger bullish push (dotted green lines) whereas a break below support (blue) could confirm (green check) the downtrend.