Short term Elliott Wave view on Gold Miners ETF (symbol: GDX) suggests it is now correcting cycle from November 1, 2019 high (28.22) as a double three Elliott Wave structure. Decline from November 1 high (28.22) ended wave A at 25.98 as a 5 waves impulse. Wave ((i)) of A ended at 27.65 and bounce in wave ((ii)) of A ended at 28.05. Index then resumed lower in wave ((iii)) of A towards 26.02 and wave ((iv)) of A ended at 26.43. Finally, wave ((v)) of A ended at 25.98.
Wave B bounce is now in progress as a double three. Up from 25.98, wave ((w)) ended at 27.50 as a zigzag. Wave (a) of ((w)) ended at 27.09, wave (b) of ((w)) ended at 26.44, and wave (c) of ((w)) ended at 27.50. Wave ((x)) pullback ended at 26.14 and wave ((y)) of B is unfolding as another zigzag. Expect the ETF to find support in short term pullback for further upside to end wave ((y)) of B. Expected area for wave ((y)) of B comes at 27.6 – 28 to end cycle from Nov 12 low before the ETF extends the decline or pullback in 3 waves at least.
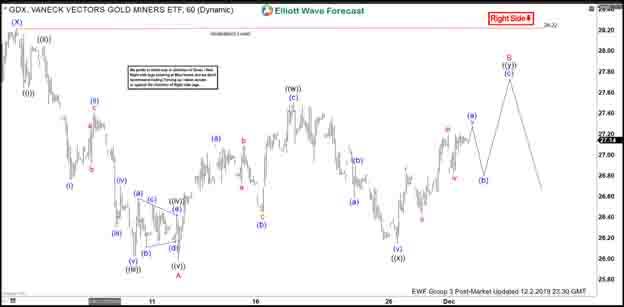
GDX 1 Hour Elliott Wave Chart