
The EUR/USD currency pair
Technical indicators of the currency pair:
Prev Open: 1.11501
Open: 1.11258
% chg. over the last day: -0.08
Day’s range: 1.11226 – 1.11436
52 wk range: 1.0879 – 1.1572
The last trading session on the EUR/USD currency pair is very active. At the same time, a unidirectional trend is not observed. At the moment, the following local support and resistance levels can be distinguished: 1.11100 and 1.11450, respectively. Monitor trade negotiations between Washington and Beijing. U.S. sales representative Robert Lighthizer provides the opportunity to sign the first phase of the agreement in early January 2020. Today in Germany and the eurozone. Open positions from key levels.
The Economic News Feed for 16.12.2019:
Business Activity Report (GER/EU) – 10:30/11:00 (GMT+2:00);
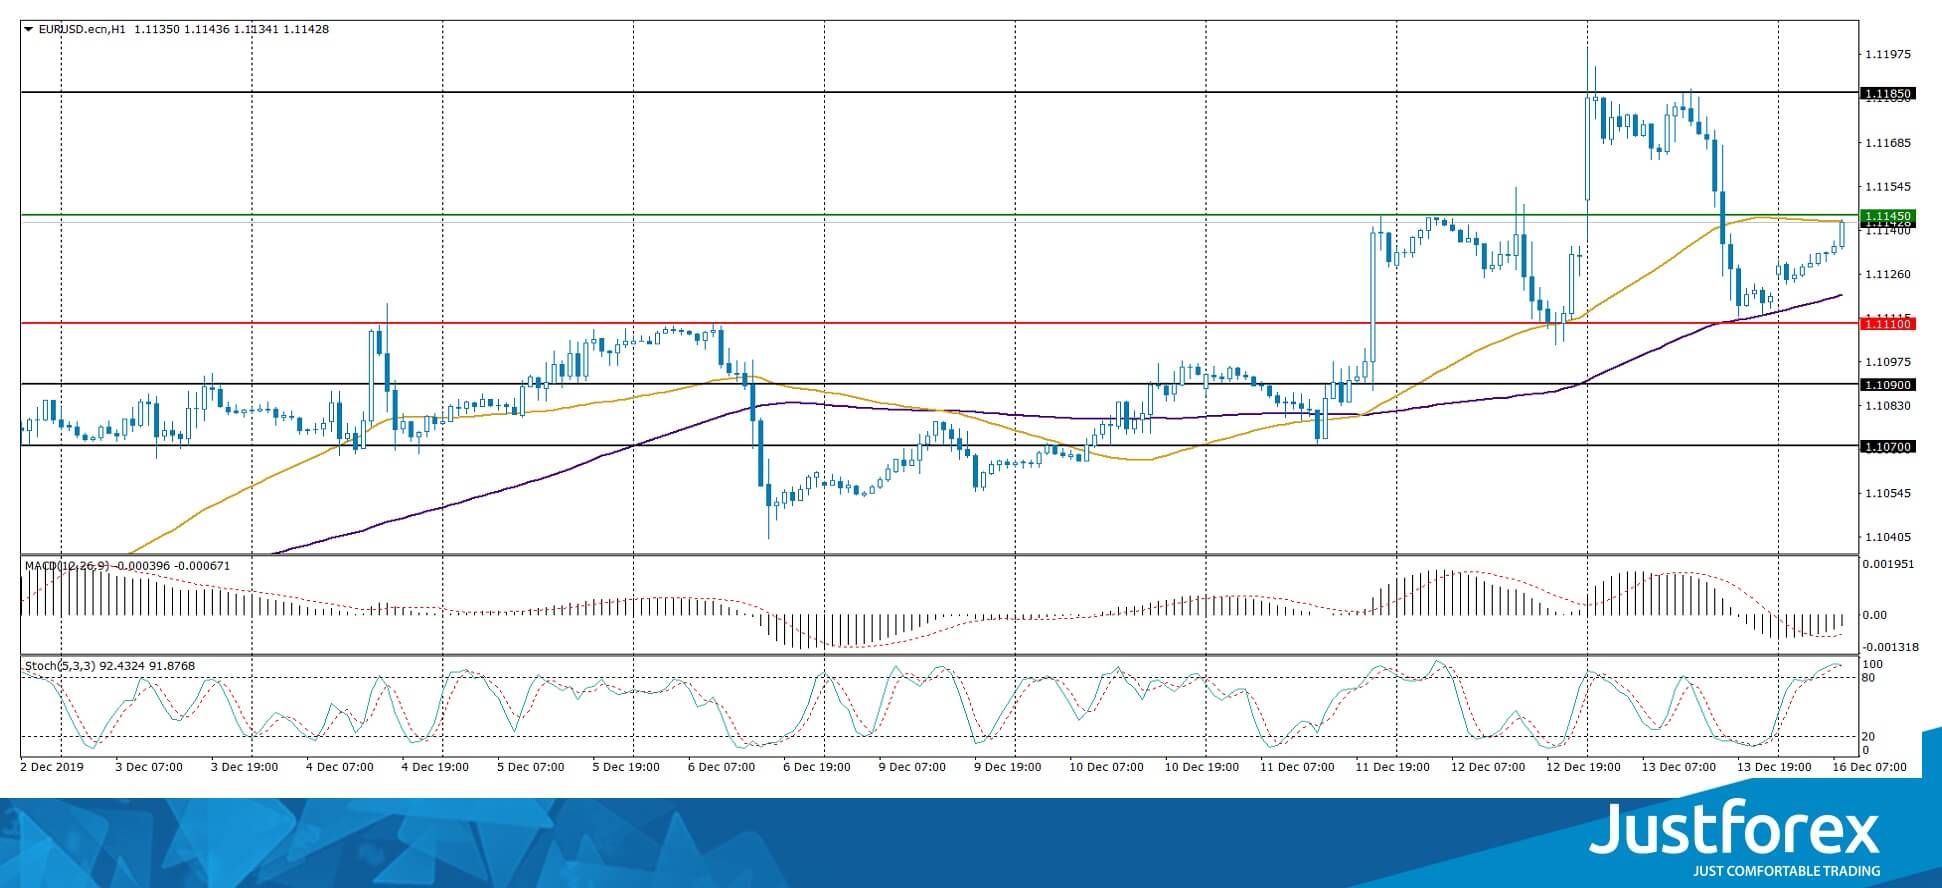
Indicators do not provide accurate signals: the price crossed 50 MA and 100 MA.
The MACD histogram is in the negative zone but above the signal line, which gives a weak signal to sell EUR/USD.
The Stochastic Oscillator is in the overbought zone, the %K line has crossed the %D line. There are currently no signals.
Trading recommendations
Support levels: 1.11100, 1.10900, 1.10700
Resistance levels: 1.11450, 1.11850, 1.12000
If the price consolidates above 1.11450, expect further growth toward 1.11800-1.12000.
Alternatively, the quotes could drop toward 1.10800-1.10600.
The GBP/USD currency pair
Technical indicators of the currency pair:
Prev Open: 1.33362
Open: 1.33390
% chg. over the last day: +1.23
Day’s range: 1.33370 – 1.34222
52 wk range: 1.1959 – 1.3516
Last week, sterling strengthened significantly against the US dollar. Demand for the pound rose after the victory of the ruling conservative party in the election. At the moment, GBP/USD quotes have stabilized. Market participants expect up-to-date information on Brexit. Today, investors will evaluate important economic releases from the UK. In the near future, technical correction of the trading instrument is not ruled out. Open positions from main levels.
At 11:30 (GMT+2:00) a number business activity indicators in the UK will be published.
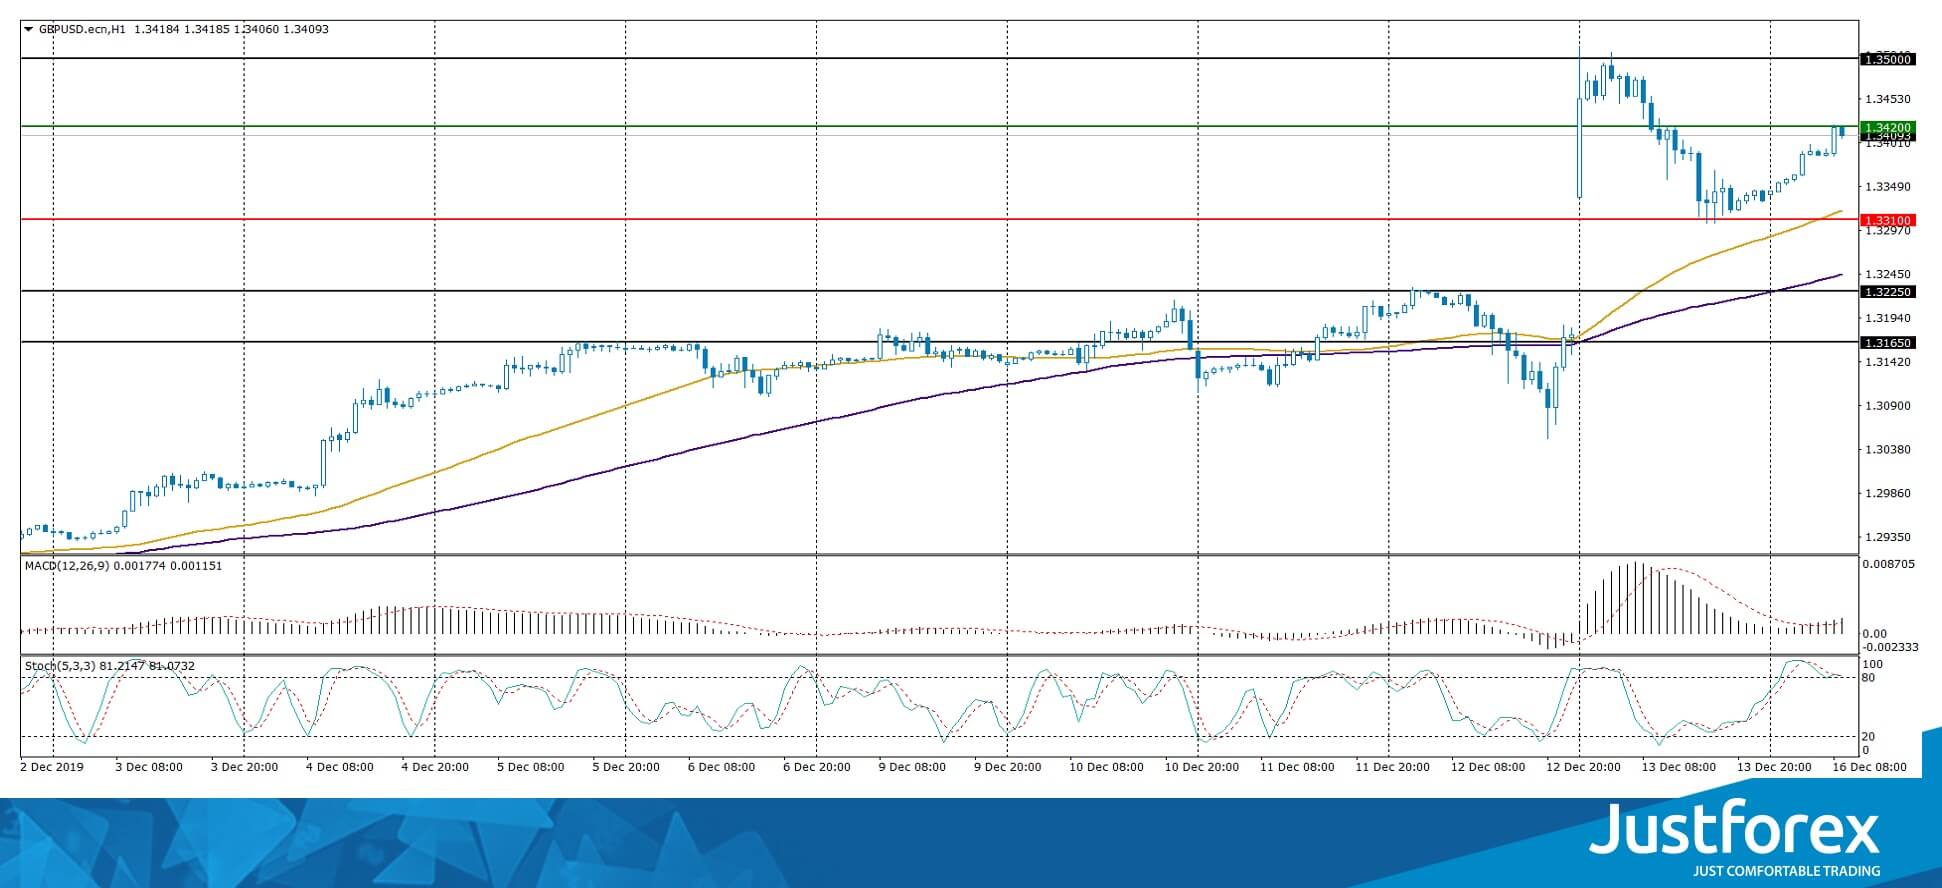
Indicators signal the power of buyers: the price has fixed above 50 MA and 100 MA.
The MACD histogram is in the positive zone and continues to rise, which gives a strong signal to buy GBP/USD.
The Stochastic Oscillator is in the overbought zone, the %K line has crossed the %D line. There are currently no signals.
Trading recommendations
Support levels: 1.33100, 1.32250, 1.31650
Resistance levels: 1.34200, 1.35000
If the price consolidates above 1.34200, expect the quotes to grow toward 1.35000-1.35400.
Alternatively, the quotes could descend toward 1.32600-1.32300.
The USD/CAD currency pair
Technical indicators of the currency pair:
Prev Open: 1.31830
Open: 1.31719
% chg. over the last day: -0.12
Day’s range: 1.31423 – 1.31862
52 wk range: 1.3014 – 1.3664
The USD/CAD currency pair continues to be traded in a flat. There is no defined trend. At the moment, quotes are testing the support level of 1.31450. 1.31750 is the nearest resistance. Looney is supported by bullish sentiment in the oil market. The trading instrument has the potential to further decline. Open positions from key levels.
The Economic News Feed for 16.12.2019 is calm.
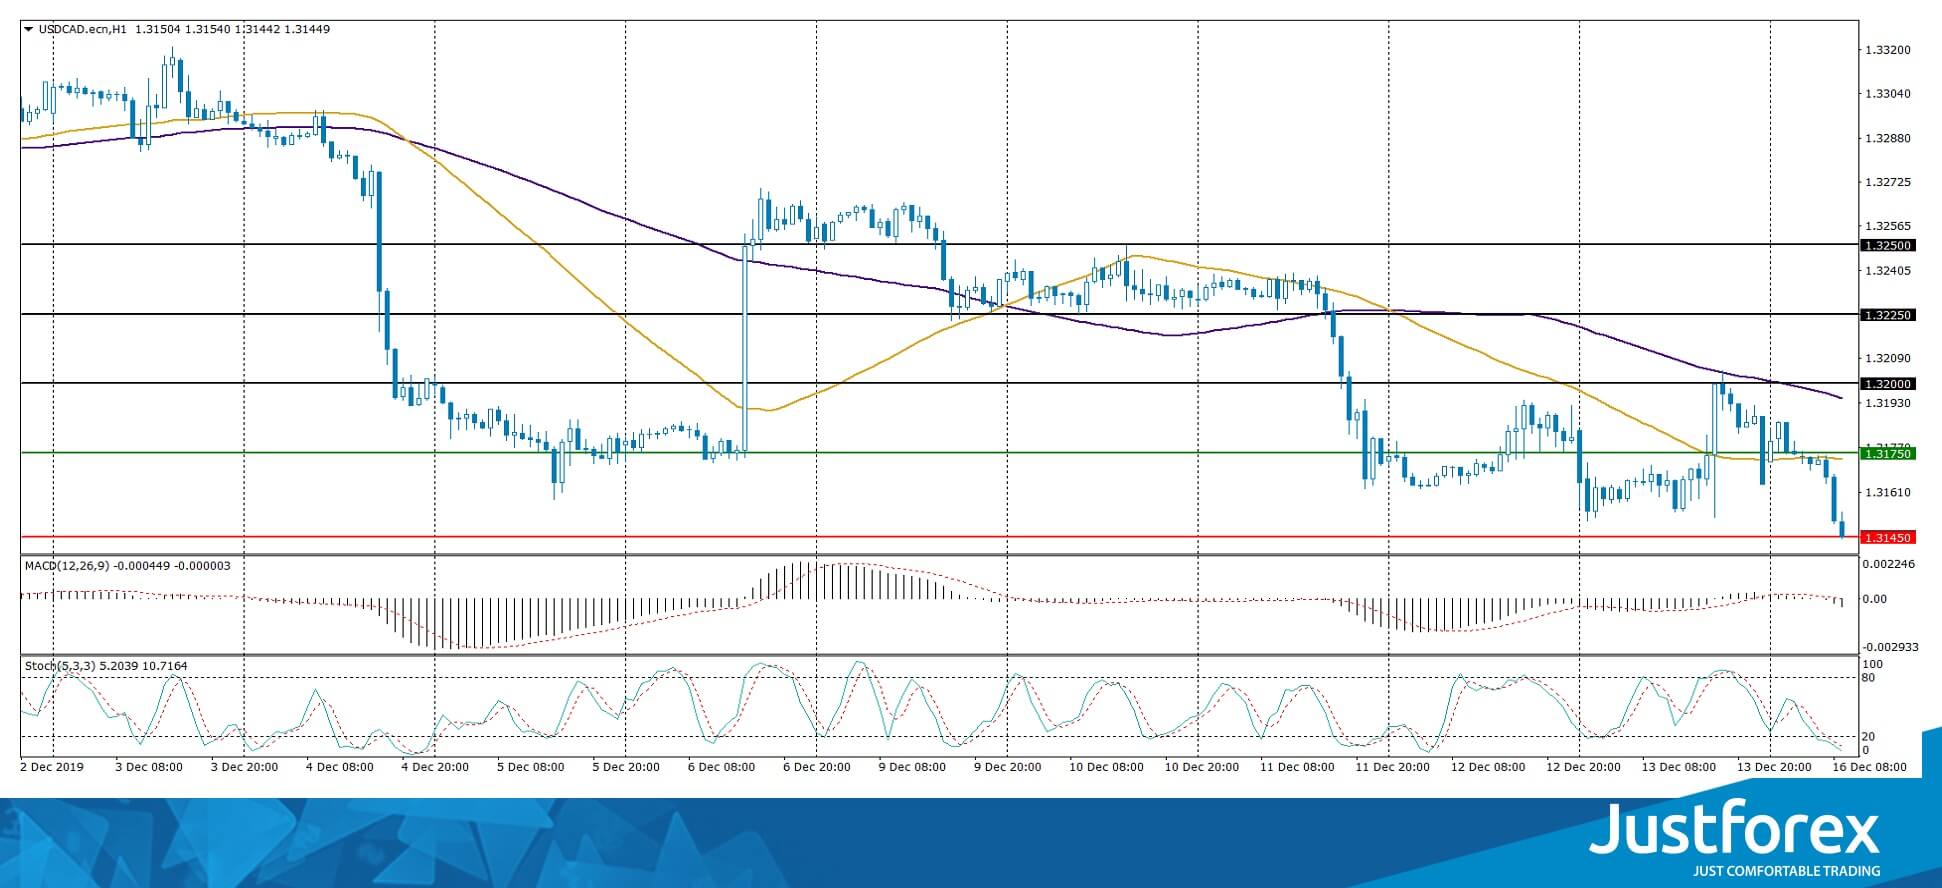
Indicators signal the power of sellers: the price has fixed below 50 MA and 100 MA.
The MACD histogram has moved into the negative zone, which also indicates a bearish sentiment.
The Stochastic Oscillator is in the oversold zone, the %K line is below the %D line, which gives a weak signal to sell USD/CAD.
Trading recommendations
Support levels: 1.31450, 1.31000
Resistance levels: 1.31750, 1.32000, 1.32250
If the price consolidates below 1.31450, expect the quotes to drop toward 1.31000.
Alternatively, the quotes could grow toward 1.31900-1.32100.
The USD/JPY currency pair
Technical indicators of the currency pair:
Prev Open: 109.197
Open: 109.292
% chg. over the last day: +0.06
Day’s range: 109.277 – 109.444
52 wk range: 104.45 – 113.53
USD/JPY stabilized after a significant increase last week. Demand for the “safe haven” currencies weakened amid the prospects for a settlement of the trade conflict between Washington and Beijing. The trading instrument is currently consolidating. The local support and resistance levels are 109.250 and 109.450, respectively. In the near future, a technical correction of the USD/JPY currency pair is possible. We recommend that you pay attention to the dynamics of yield on US government bonds. Open positions from key levels.
The Economic News Feed for 16.12.2019 is calm.
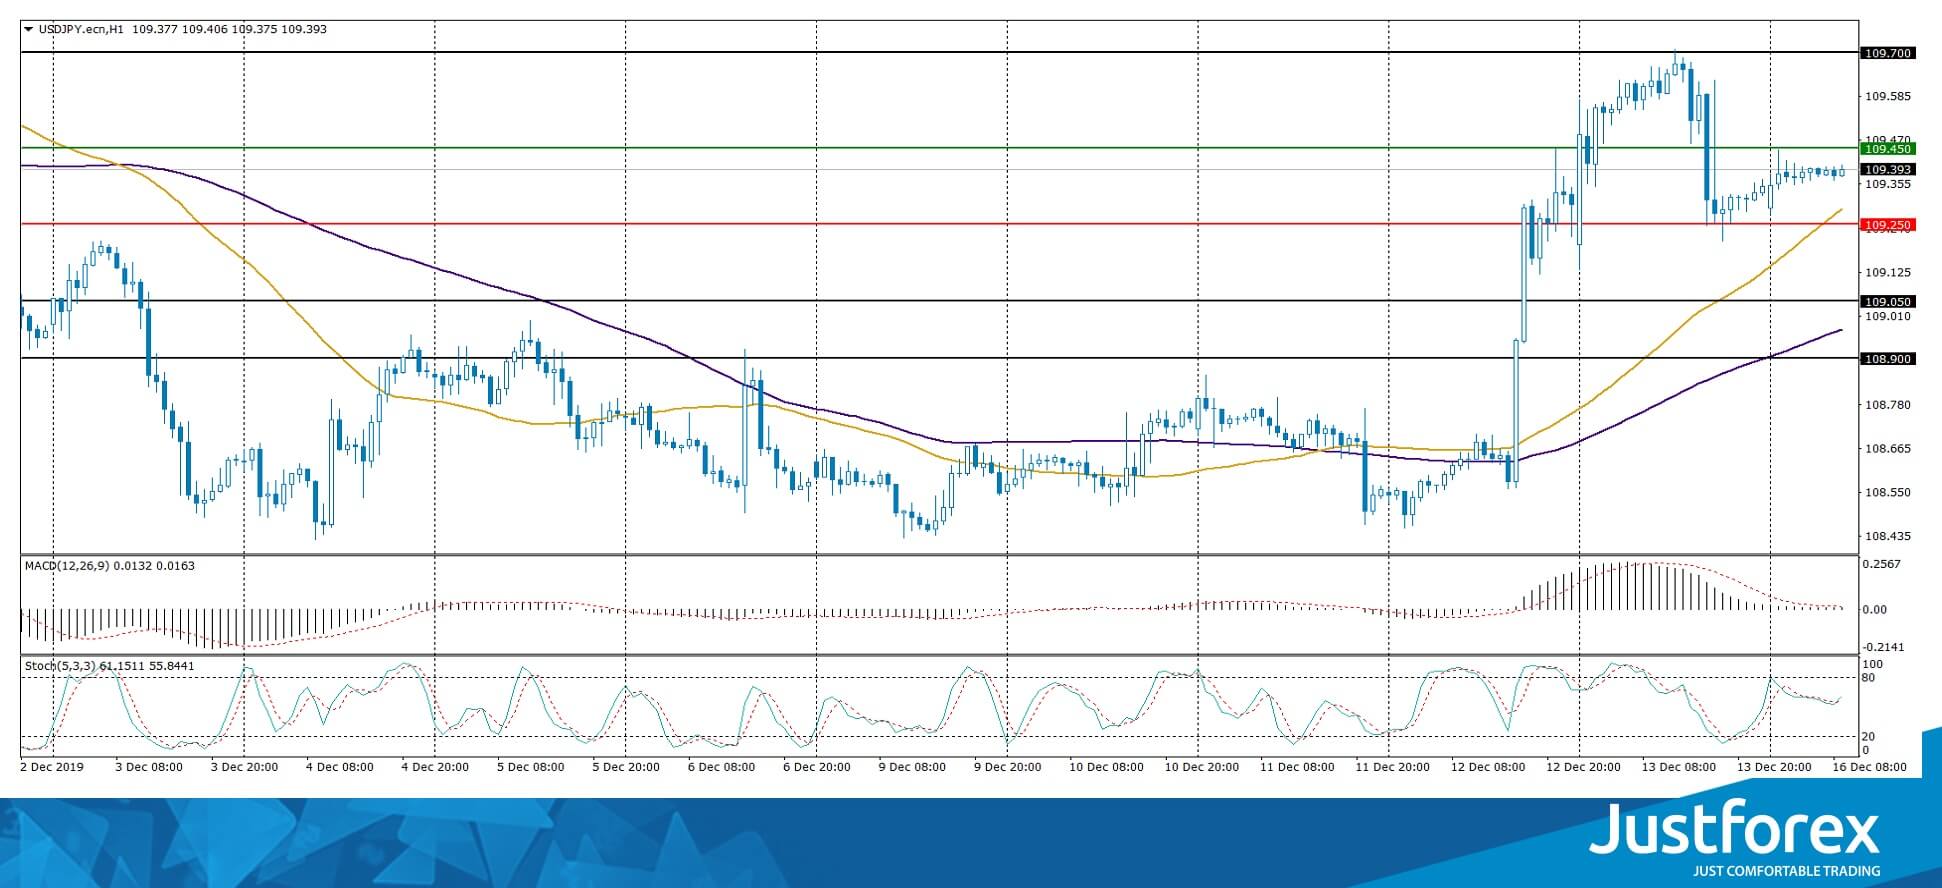
The price has fixed above 50 MA and 100 MA, which signals the power of buyers.
The MACD histogram is close to 0. There are no signals at the moment.
The Stochastic Oscillator is in the neutral zone, the %K line crossed the %D line. There are no accurate signals.
Trading recommendations
Support levels: 109.250, 109.050, 108.900
Resistance levels: 109.450, 109.700
If the price consolidates above 109.450, expect the quotes to grow toward 109.700-110.000.
Alternatively, the quotes could descend toward 109.100-108.900.


