
The EUR/USD currency pair
Technical indicators of the currency pair:
Prev Open: 1.11351
Open: 1.10905
% chg. over the last day: -0.40
Day’s range: 1.10889 – 1.11024
52 wk range: 1.0879 – 1.1572
The EUR/USD currency pair is dominated by bearish sentiment. Greenback is supported by a series of optimistic economic releases from the US, which was published last week. At the moment, the trading instrument is testing a key support level of 1.10900. Mark 1.11100 is already a “mirror” resistance. The technical picture signals a further decline in the EUR / USD currency pair. We recommend opening positions from key levels.
Today the news background is calm. US financial markets will be closed due to the holiday.
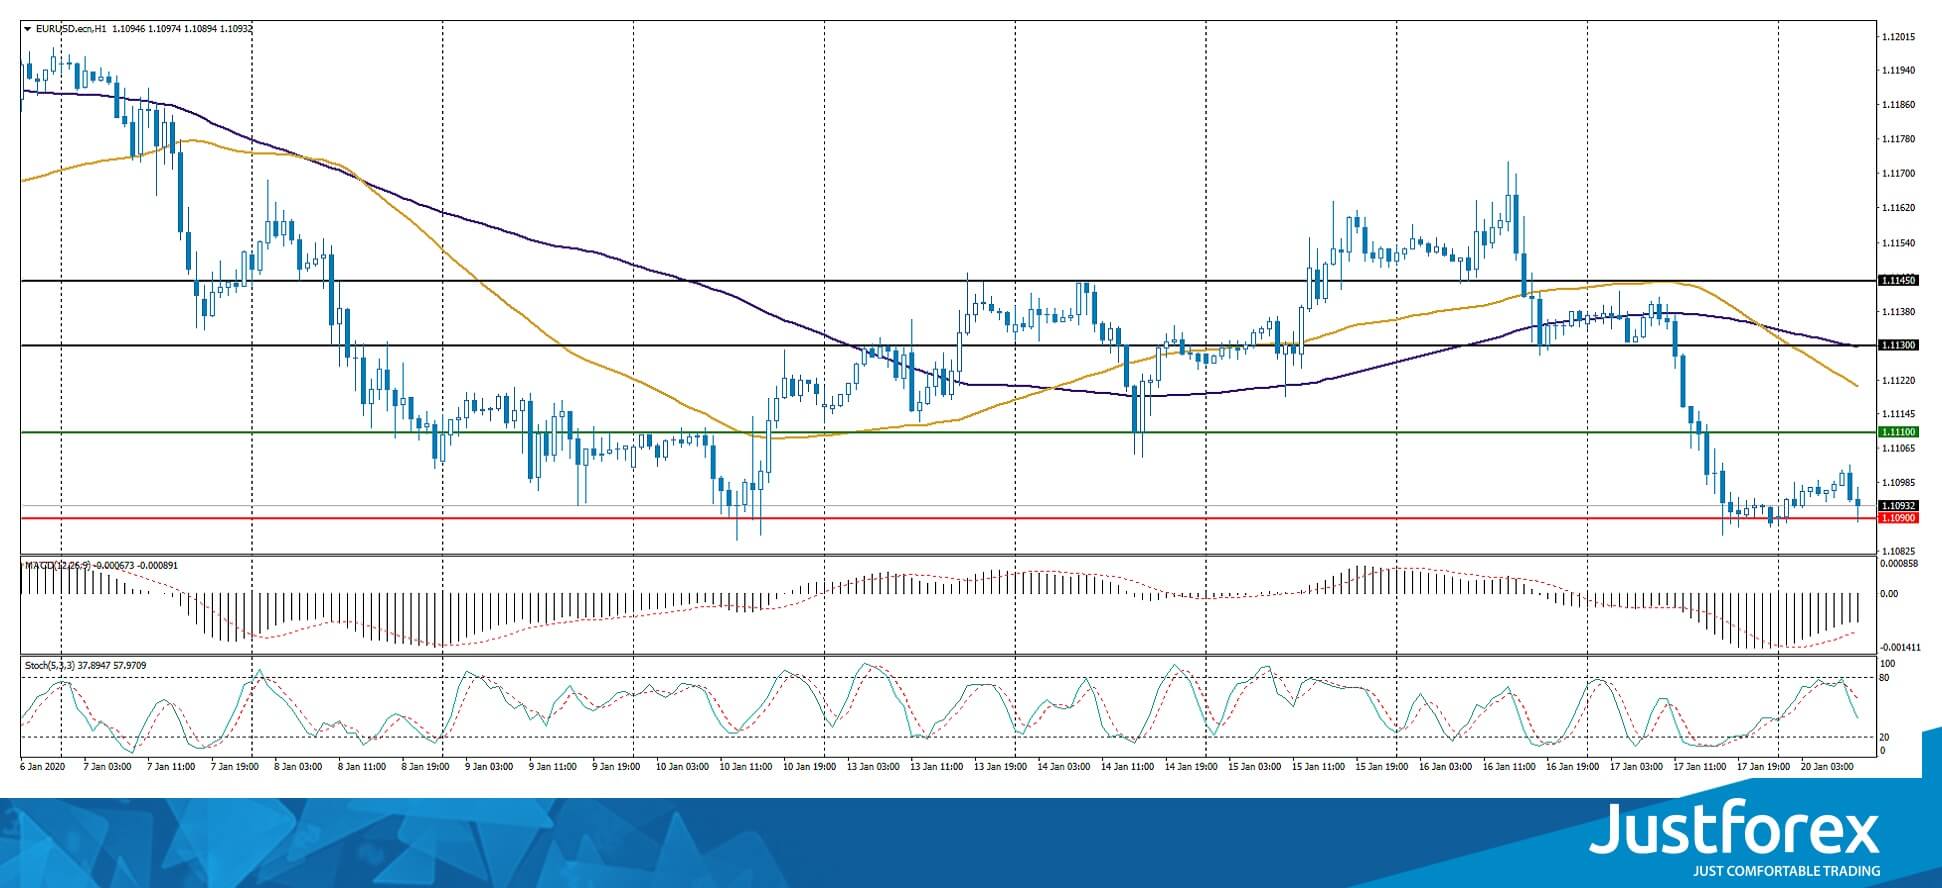
Indicators signal the strength of sellers: the price has fixed below 50 MA and 100 MA.
The MACD histogram is in the negative zone, but above the signal line, which gives a weak signal to sell EUR/USD.
The Stochastic Oscillator is in the neutral zone, the %K line is below the %D line, which indicates a bearish sentiment.
Trading recommendations
Support levels: 1.10900, 1.10500
Resistance levels: 1.11100, 1.11300, 1.11450
If the price consolidates below the level of 1.10900, expect a further drop toward 1.10600-1.10400.
Alternatively, the quotes could grow toward 1.11300-1.11400.
The GBP/USD currency pair
Technical indicators of the currency pair:
Prev Open: 1.30777
Open: 1.29928
% chg. over the last day: -0.64
Day’s range: 1.29705 – 1.30090
52 wk range: 1.1959 – 1.3516
GBP/USD quotes went down. Sterling set new local lows. Demand for the US dollar remains at a fairly high level. At the moment, the key support and resistance levels are 1.29600 and 1.30150, respectively. The GBP/USD currency pair has the potential for further decline. Investors expect up-to-date information on Brexit. Open positions from key levels.
The Economic News Feed for 20.01.2020 is calm.
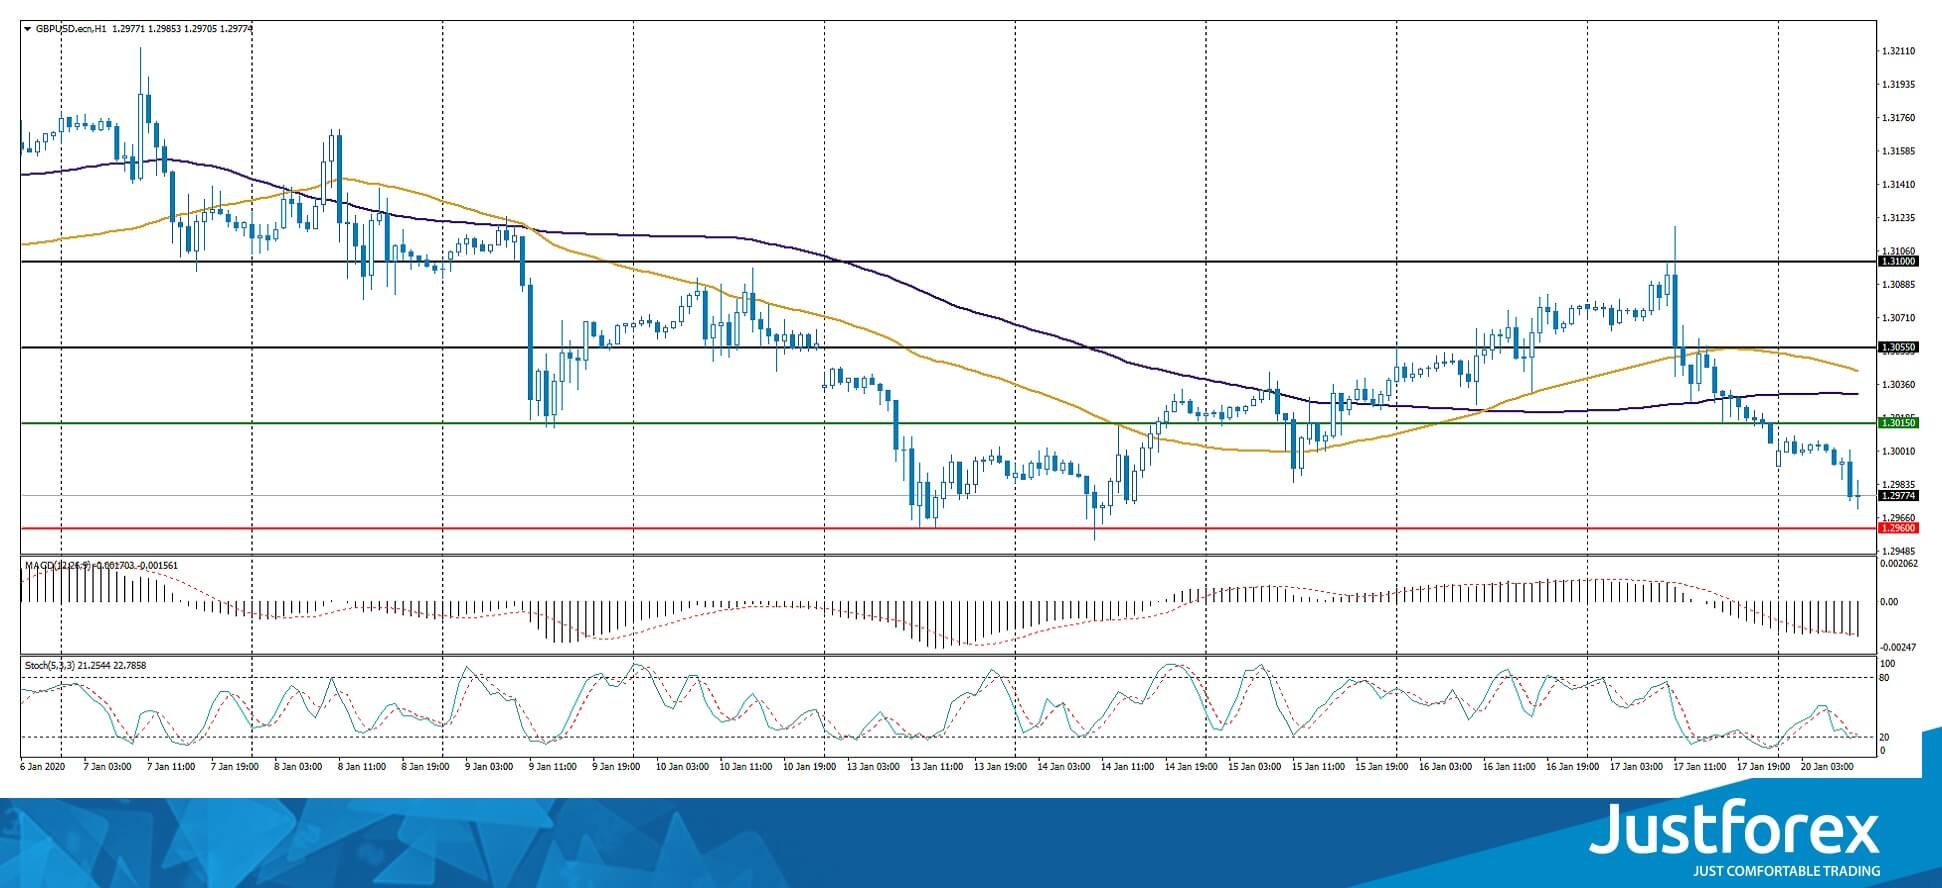
The price fixed below 100 MA, which signals the strength of sellers.
The MACD histogram is in the negative zone and continues to decline, indicating a bearish mood.
The Stochastic Oscillator is near the oversold zone, the %K line crossed the %D line. There are no signals at the moment.
Trading recommendations
Support levels: 1.29600, 1.29200, 1.29000
Resistance levels: 1.30150, 1.30550, 1.31000
If the price consolidates below 1.29600, expect a further drop toward 1.29300-1.29100.
Alternatively, the quotes could grow toward 1.30400-1.30600.
The USD/CAD currency pair
Technical indicators of the currency pair:
Prev Open: 1.30415
Open: 1.30579
% chg. over the last day: +0.12
Day’s range: 1.30550 – 1.30710
52 wk range: 1.2949 – 1.3566
The USD/CAD currency pair continues to trade in a long flat. There are no defined trends. Participants in financial markets expect additional drivers. At the moment, the following local support and resistance levels can be distinguished: 1.30500 and 1.30750, respectively. A trading instrument has potential for growth. We recommend that you pay attention to the dynamics of prices of “black gold”. Open positions from key levels.
The Economic News Feed for 20.01.2020 is calm.
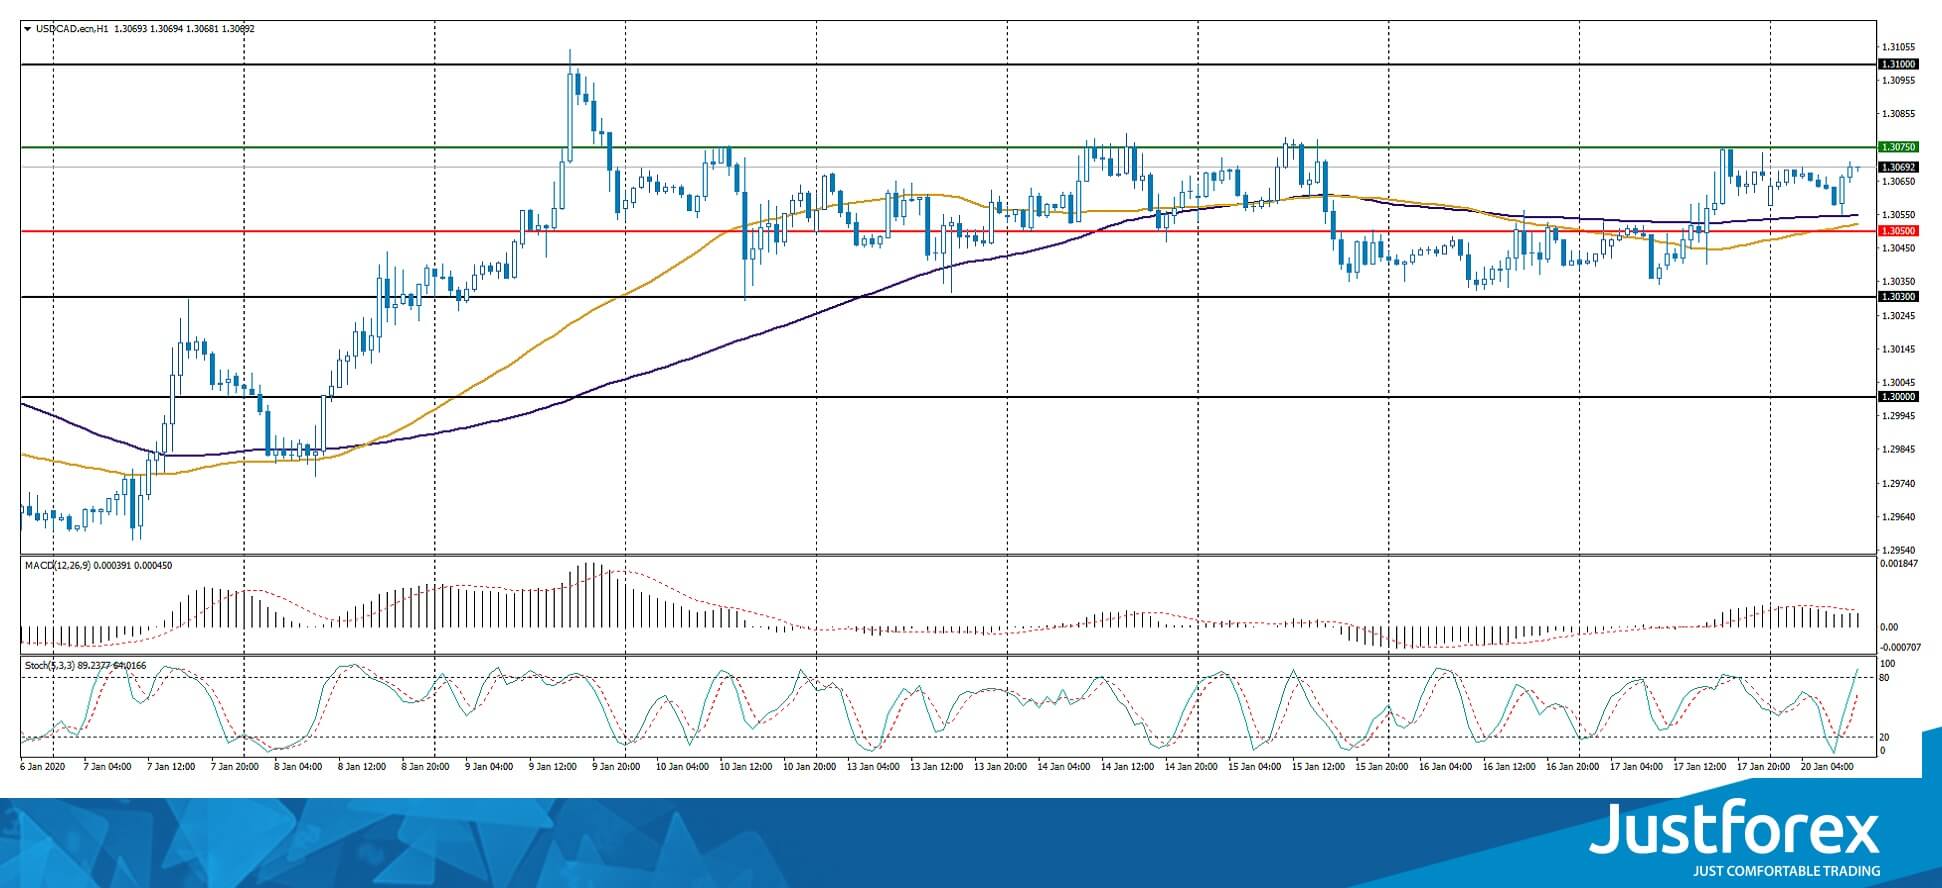
Indicators do not give accurate signals: 50 MA crossed 100 MA.
The MACD histogram has moved into the positive zone, indicating bullish sentiment.
The Stochastic Oscillator is in the neutral zone, the% K line is above the% D line, which gives a signal to buy USD / CAD.
Trading recommendations
Support levels: 1.30500, 1.30300, 1.30000
Resistance levels: 1.30750, 1.31000, 1.31300
If the price consolidates above 1.30750, USD/CAD quotes are expected to rise. The potential movement is to 1.31000-1.31200.
Alternatively, the quotes could descend toward 1.30300-1.30000.
The USD/JPY currency pair
Technical indicators of the currency pair:
Prev Open: 110.138
Open: 110.077
% chg. over the last day: -0.05
Day’s range: 110.077 – 110.216
52 wk range: 104.45 – 113.53
The USD/JPY currency pair has stabilized after continued growth. The trading instrument is currently consolidating. Local levels of support and resistance are: 110.000 and 110.300, respectively. In the near future, a technical correction is possible. We recommend that you keep track of current information regarding the second phase of the trade agreement between Washington and Beijing. Open positions from key levels.
The news background on the Japanese economy is calm.
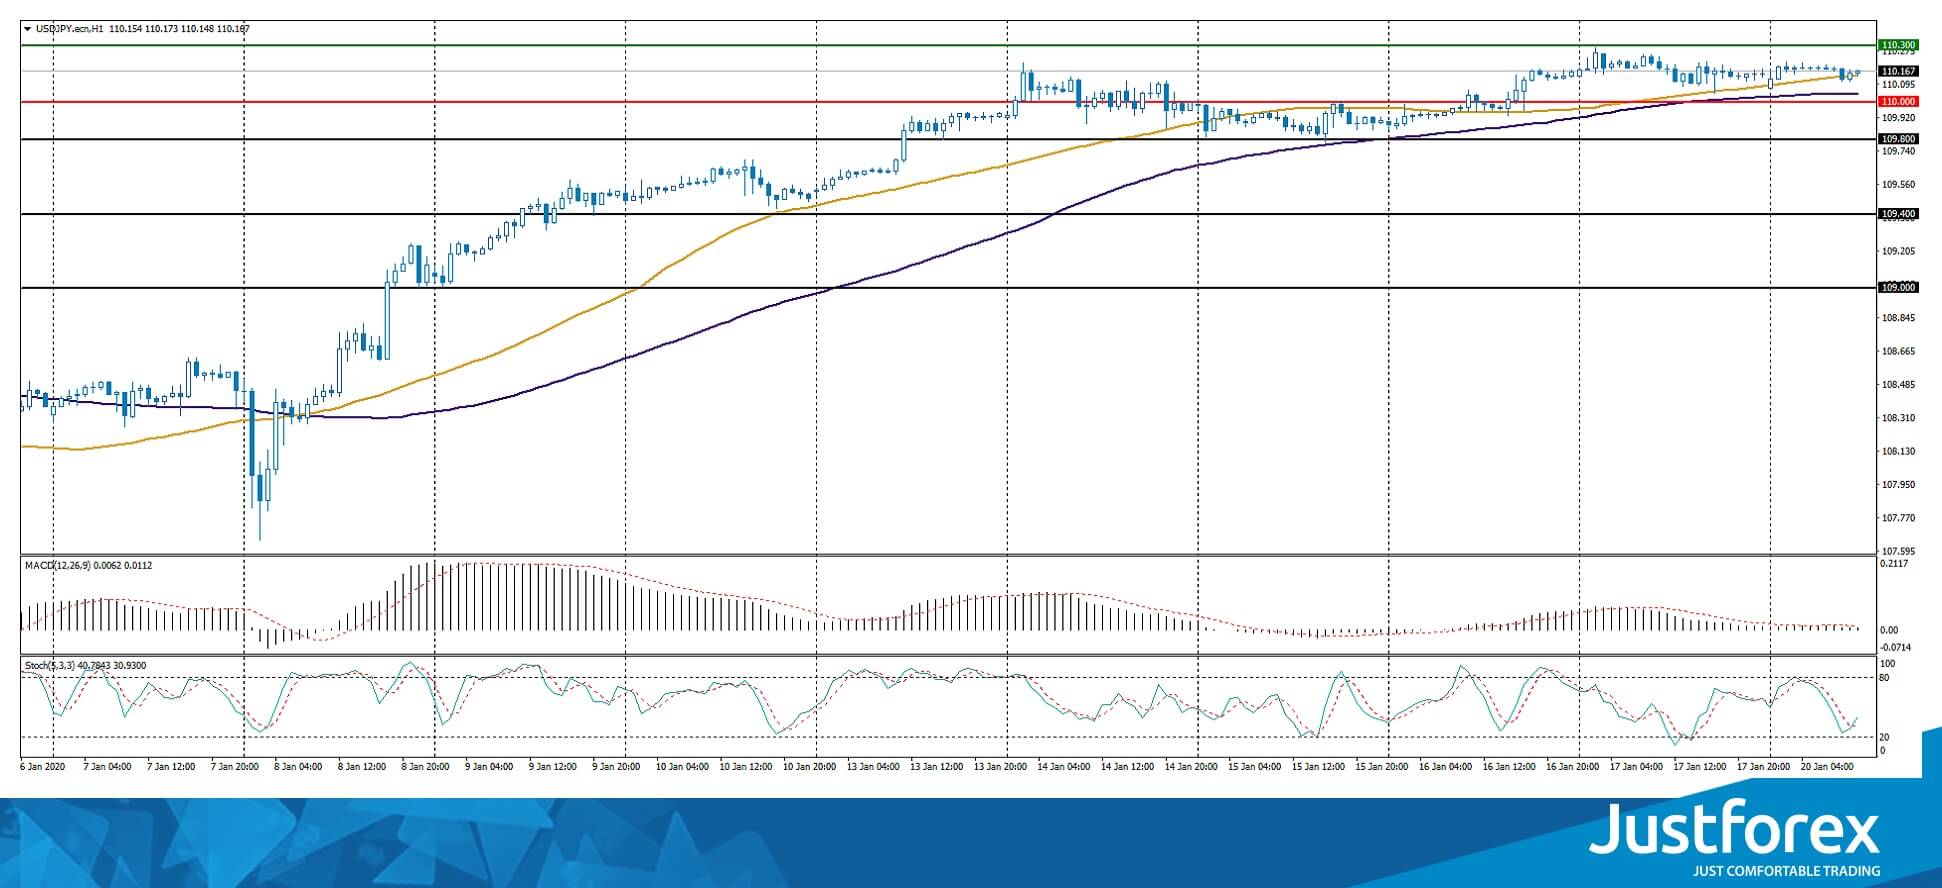
Indicators do not give accurate signals: the price crossed 50 MA.
The MACD histogram is near the 0 mark.
The Stochastic Oscillator is in the neutral zone, the %K line crossed the %D line. There are no signals at the moment.
Trading recommendations
Support levels: 110.000, 109.800, 109.400
Resistance levels: 110.300, 110.600
If the price consolidates above 110.300, expect further grotwht toward 110.600-110.800.
Alternatively, the quotes could correct toward 109.600-109.400.


