
The EUR/USD currency pair
Technical indicators of the currency pair:
Prev Open: 1.10905
Open: 1.10939
% chg. over the last day: +0.01
Day’s range: 1.10889 – 1.10994
52 wk range: 1.0879 – 1.1572
The EUR/USD currency pair stabilized after a sharp decline at the end of last week. At the moment, the trading instrument is in lateral movement. Unidirectional trends are not observed. EUR / USD quotes test local support and resistance levels: 1.10800 and 1.11000, respectively. Participants in financial markets expect additional drivers. The demand for greenback is still at a fairly high level. We recommend opening positions from key levels.
At 12:00 (GMT+2: 00), Germany will publish the ZEW economic sentiment indices.
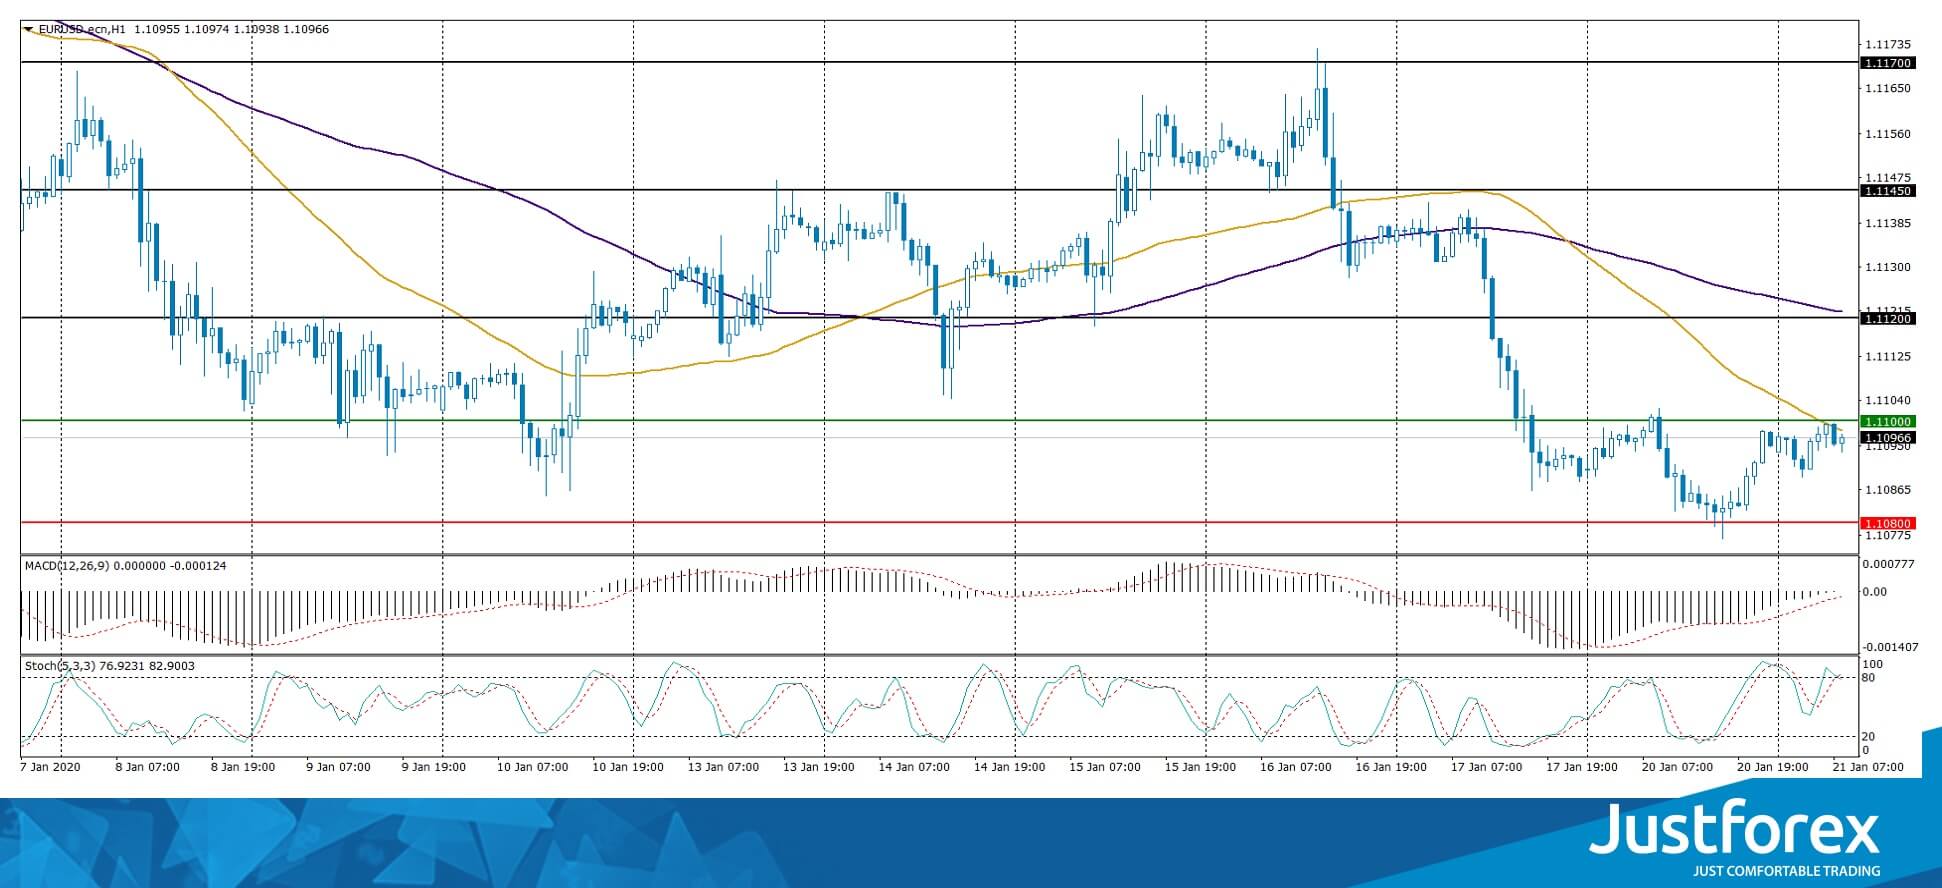
Indicators do not give accurate signals: the price crossed 50 MA.
The MACD histogram is near the 0 mark.
The Stochastic Oscillator is near the overbought zone, the %K line crossed the %D line. There are no signals at the moment.
Trading recommendations
Support levels: 1.10800, 1.10500
Resistance levels: 1.11000, 1.11200, 1.11450
If the price consolidates below 1.10800, expect a further descend toward 1.10500-1.10300.
Alternatively, the quotes could recover toward 1.11200-1.11400.
The GBP/USD currency pair
Technical indicators of the currency pair:
Prev Open: 1.29928
Open: 1.30076
% chg. over the last day: +0.02
Day’s range: 1.29956 – 1.30216
52 wk range: 1.1959 – 1.3516
GBP/USD quotes retreated from local lows. The pound is currently consolidating. The local support and resistance levels are 1.29900 and 1.30200, respectively. The current technical picture signals a further correction of the GBP/USD currency pair. Investors expect important statistics on the UK economy. Open positions be opened from key levels.
At 11:30 (GMT+2:00) a report on the UK labor market will be published.
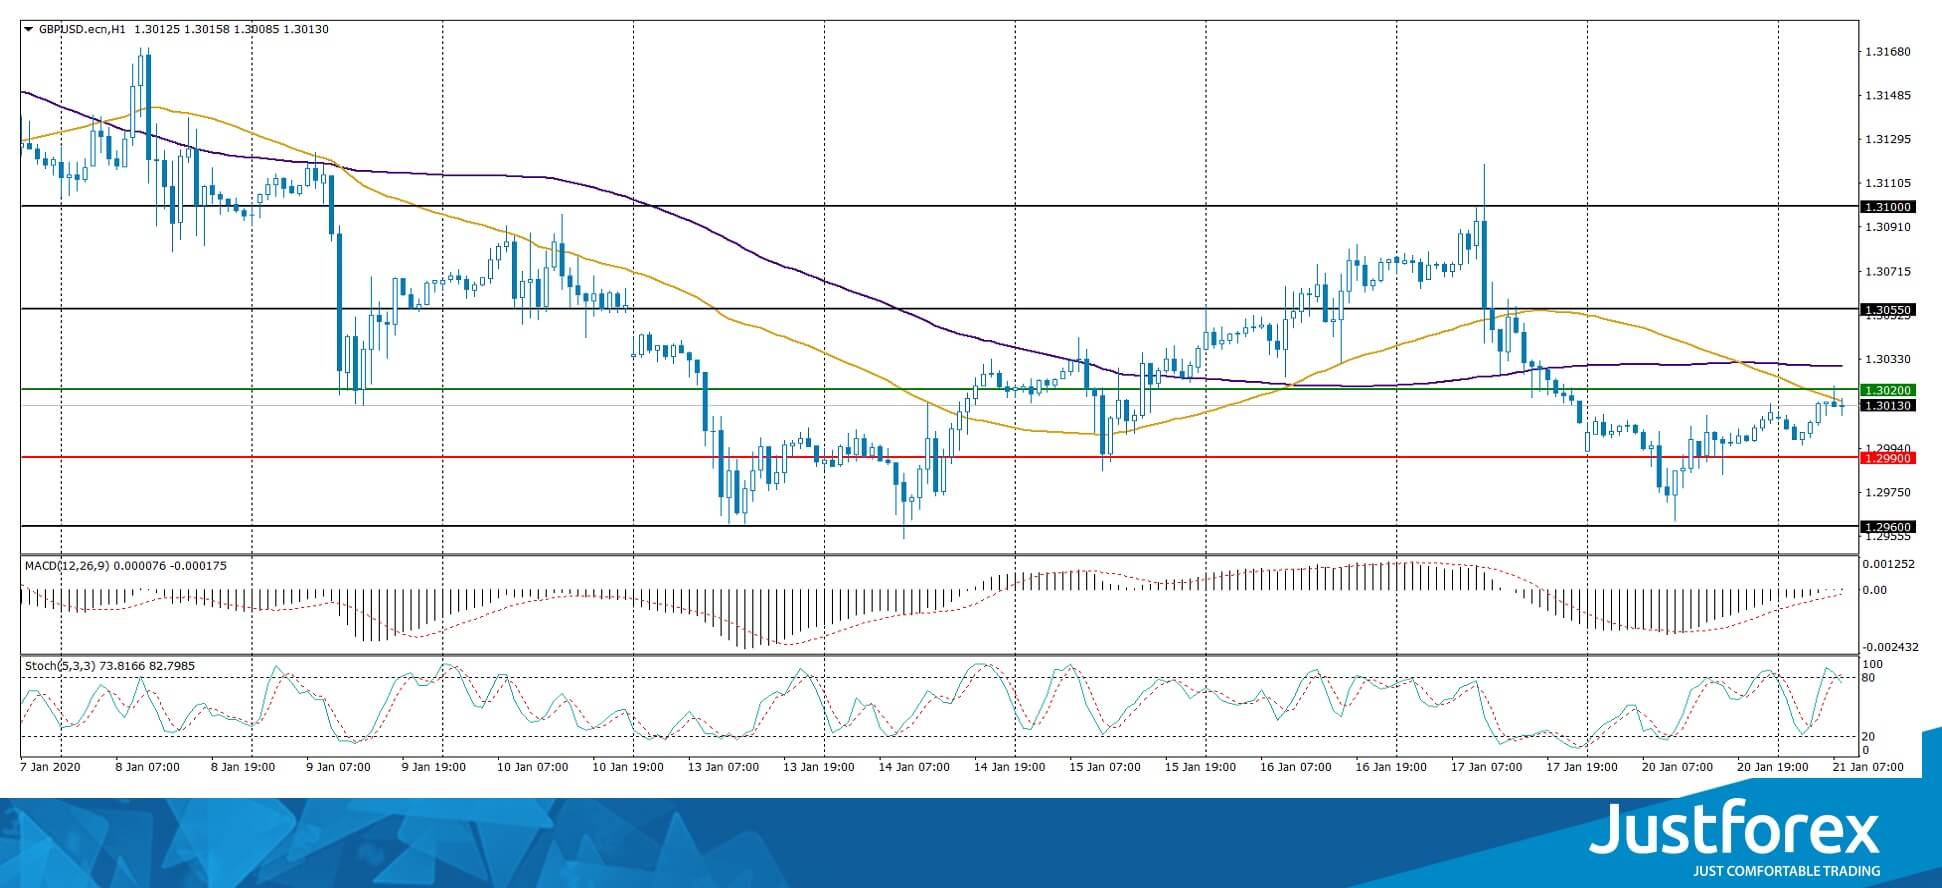
Indicators do not give accurate signals: the price crossed 50 MA.
The MACD histogram is near the 0 mark.
The Stochastic Oscillator is near the overbought zone, the% K line crossed the% D line. There are no signals at the moment.
Trading recommendations
Support levels: 1.29900, 1.29600
Resistance levels: 1.30200, 1.30550, 1.31000
If the price consolidates above 1.30200, expect the quotes to rise toward 1.30500-1.30800.
Alternatively, the quotes could descend toward 1.29600-1.29400.
The USD/CAD currency pair
Technical indicators of the currency pair:
Prev Open: 1.30579
Open: 1.30474
% chg. over the last day: -0.15
Day’s range: 1.30446 – 1.30658
52 wk range: 1.2949 – 1.3566
CAD is still trading in a protracted flat. Unidirectional trends are not observed. At the moment, the following key support and resistance levels can be identified: 1.30450 and 1.30750, respectively. USD/CAD quotes have a potential for recovery. We recommend you to pay attention to the dynamics of prices of black gold. Open positions from key levels.
At 15:30 (GMT + 2: 00), a report on sales in Canada’s manufacturing sector will be published.
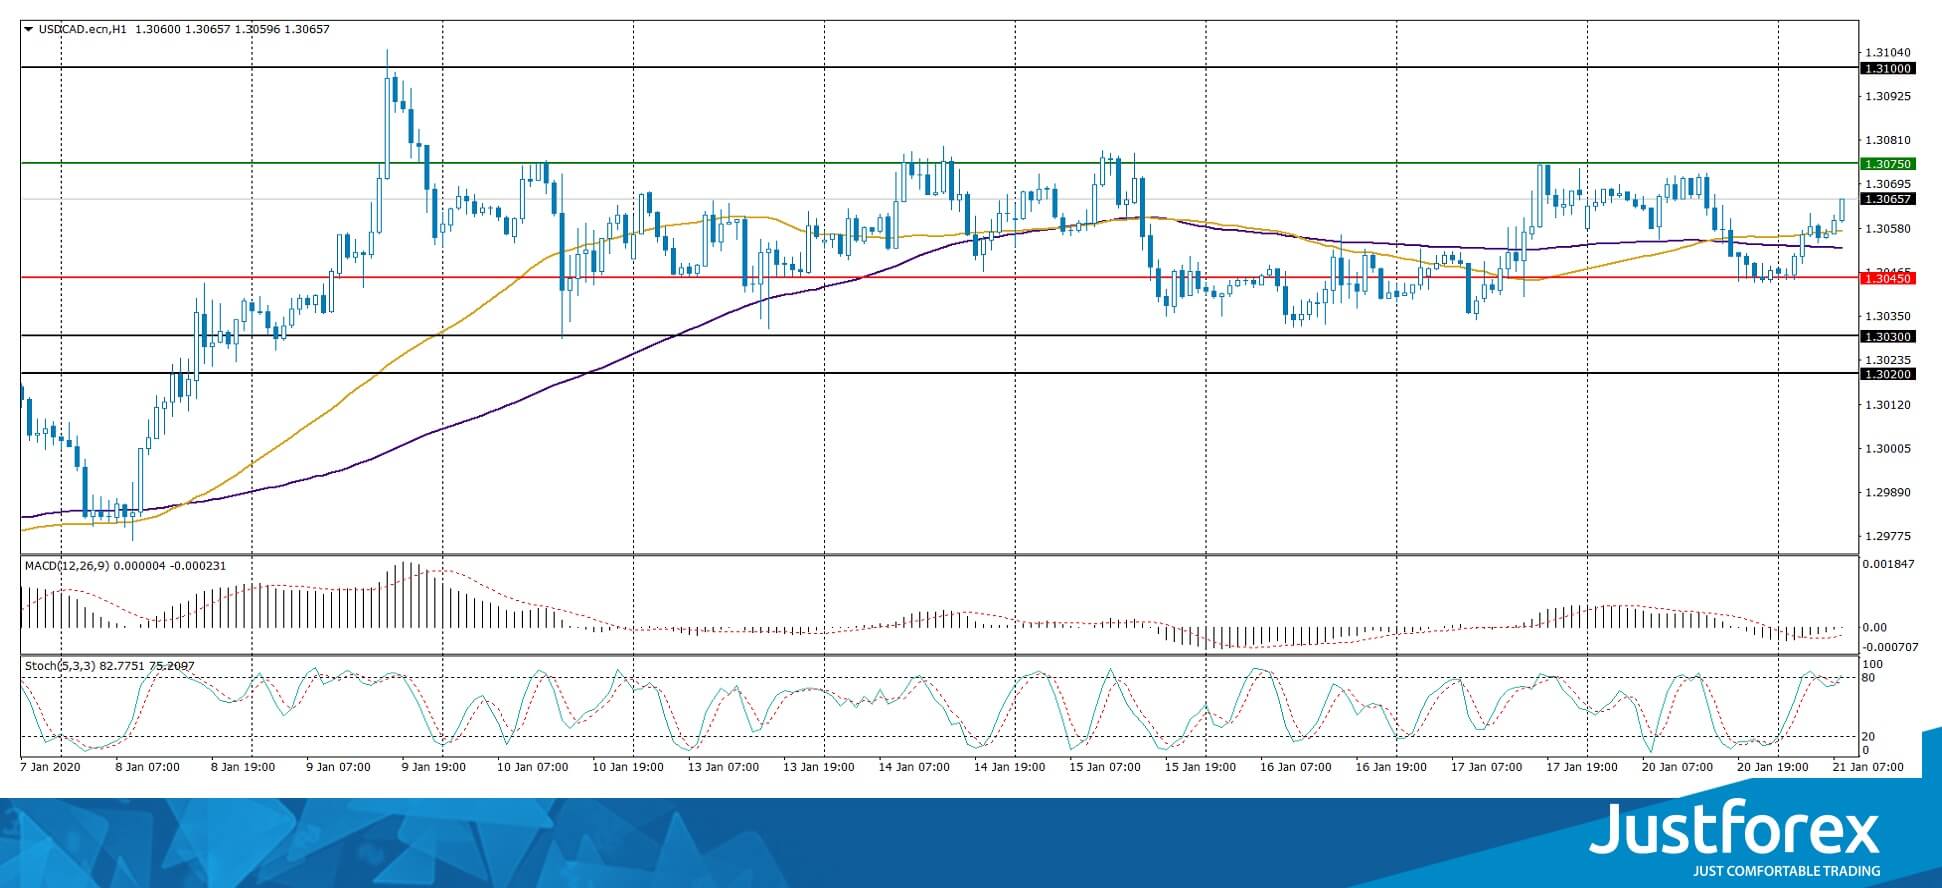
Indicatorsdo not give accurate signals: the price crossed 50 MA and 100 MA.
The MACD histogram is near the 0 mark.
The Stochastic Oscillator is near the overbought zone, the %K line crossed the %D line. There are no signals at the moment.
Trading recommendations
Support levels: 1.30450, 1.30300, 1.30200
Resistance levels: 1.30750, 1.31000
If the price consolidates above 1.30750, expect the quotes to rise toward 1.31000-1.31300.
Alternatively, the quotes could descend toward 1.30200-1.30000.
The USD/JPY currency pair
Technical indicators of the currency pair:
Prev Open: 110.077
Open: 110.176
% chg. over the last day: +0.04
Day’s range: 109.887 – 110.221
52 wk range: 104.45 – 113.53
The USD/JPY currency pair went down. A trading instrument has the potential for further correction after a protracted rally. At the moment, the key range is 109.850-110.300. The Bank of Japan, as expected, kept the basic parameters of monetary policy unchanged. The regulator published optimistic forecasts for the country’s GDP. We recommend that you pay attention to the dynamics of yield on US government bonds. Open positions from key levels.
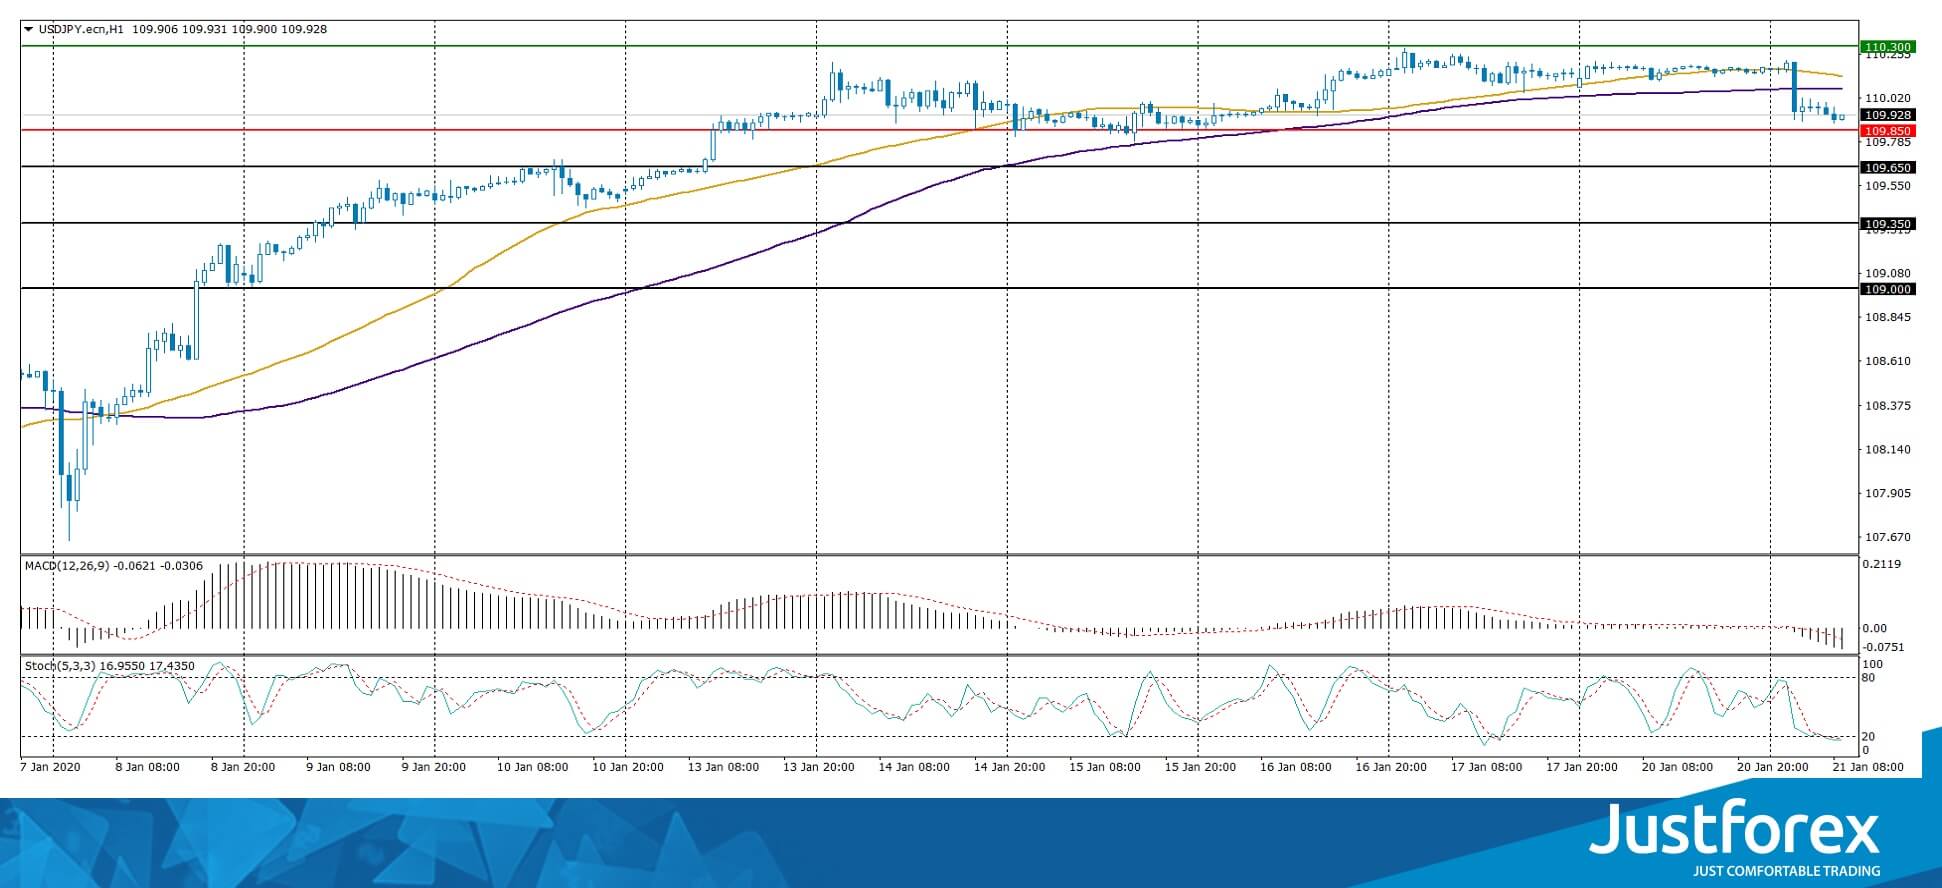
Indicators of accurate signals do not give: the price crossed 50 MA and 100 MA.
The MACD histogram is in the negative zone, which indicates a bearish mood.
The Stochastic Oscillator is in the oversold zone, the% K line crossed the% D line. There are no signals at the moment.
Trading recommendations
Support levels: 109.850, 109.650, 109.350
Resistance levels: 110.300, 110.600
If the price consolidates below 109.850, expect a correction toward 109.500-109.200.
Alternatively, the quotes could grow toward 110.500-110.700.


