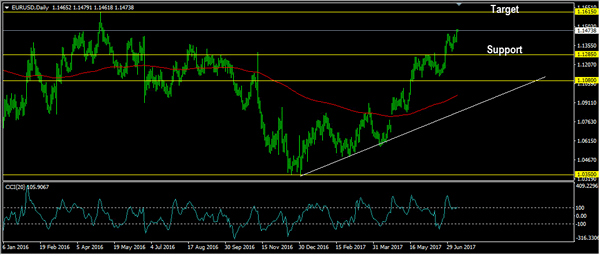
EURUSD
As expected, the EURUSD had a bullish momentum yesterday topped at 1.1479. The bias is bullish in nearest term testing 1.1500 – 1.1530 area before targeting 1.1615 key resistance (weekly EMA 200 and 2016 high) this week. Immediate support is seen around 1.1425. A clear break below that area could lead price to neutral zone in nearest term testing 1.1350 – 1.1285 support area but overall I remain bullish and any downside pullback should be seen as a good opportunity to buy.
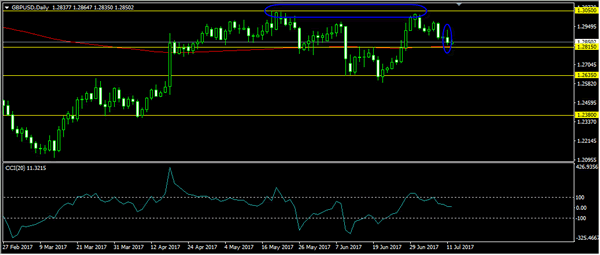
GBPUSD
The GBPUSD attempted to push higher yesterday topped at 1.2927 but closed lower at 1.2845. As you can see on my daily chart below, price formed a bearish pin bar on daily chart, suggests a bearish continuation scenario after the rejection to move above 1.3050 resistance. The bias remains bearish in nearest term testing 1.2815/00. A clear break and daily close below 1.2800 would expose 1.2635 area this week. Immediate resistance is seen around 1.2927 (yesterday’s high). A clear break above that area could lead price to neutral zone in nearest term testing 1.3000 but key resistance remains at 1.3050 which remains a good place to sell with a tight stop loss.
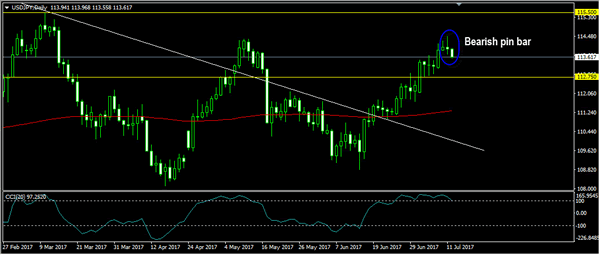
USDJPY
The USDJPY attempted to push higher yesterday topped at 114.49 but closed lower at 113.94 and hit 113.51 earlier today in Asian session. Overall I remain bullish, but we have a bearish pin bar on daily chart as you can see on my daily chart below suggests a potential bearish pullback. The bias is bearish in nearest term testing 113.35/00 region (H1 EMA 200). A clear break below that area would expose 112.75 region which is a good place to buy with a tight stop loss. On the upside, we need a clear break above 114.49 to continue the bullish scenario targeting 115.00/50 or higher.
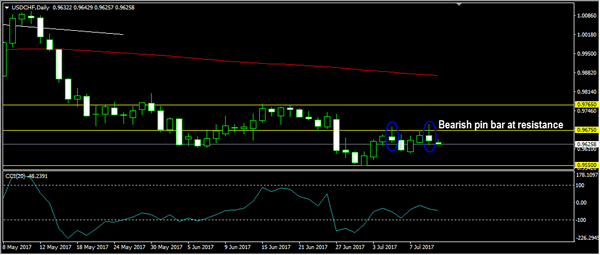
USDCHF
The USDCHF attempted to push higher yesterday topped at 0.9696 but closed lower at 0.9638. As you can see on my daily chart below, we have another bearish pin bar after rejection to break above 0.9675 resistance, suggests a bearish view. The bias is bearish in nearest term testing 0.9600 – 0.9550. Immediate resistance is seen around 0.9696. A clear break above that area could lead price to neutral zone in nearest term testing 0.9765 region. On the downside, 0.9550 – 0.9450 area remains a key support and good place to buy with a tight stop loss below 0.9450.