
The EUR/USD currency pair
Technical indicators of the currency pair:
Prev Open: 1.08738
Open: 1.08405
% chg. over the last day: -0.29
Day’s range: 1.08273 – 1.08419
52 wk range: 1.0879 – 1.1572
The EUR/USD currency pair continues to show a steady downtrend. The trading instrument has updated its two-year lows. EUR remains under pressure amid weak economic releases, as well as fears about the impact of the epidemic in China. At the moment EUR/USD quotes are consolidating. Local support and resistance levels are at 1.08250 and 1.08650, respectively. We recommend opening positions from these markers.
The Economic News Feed for 14.02.2020:
GDP Report (EU) – 12:00 (GMT+2:00);
Retail Sales Report (US) – 15:30 (GMT+2:00);
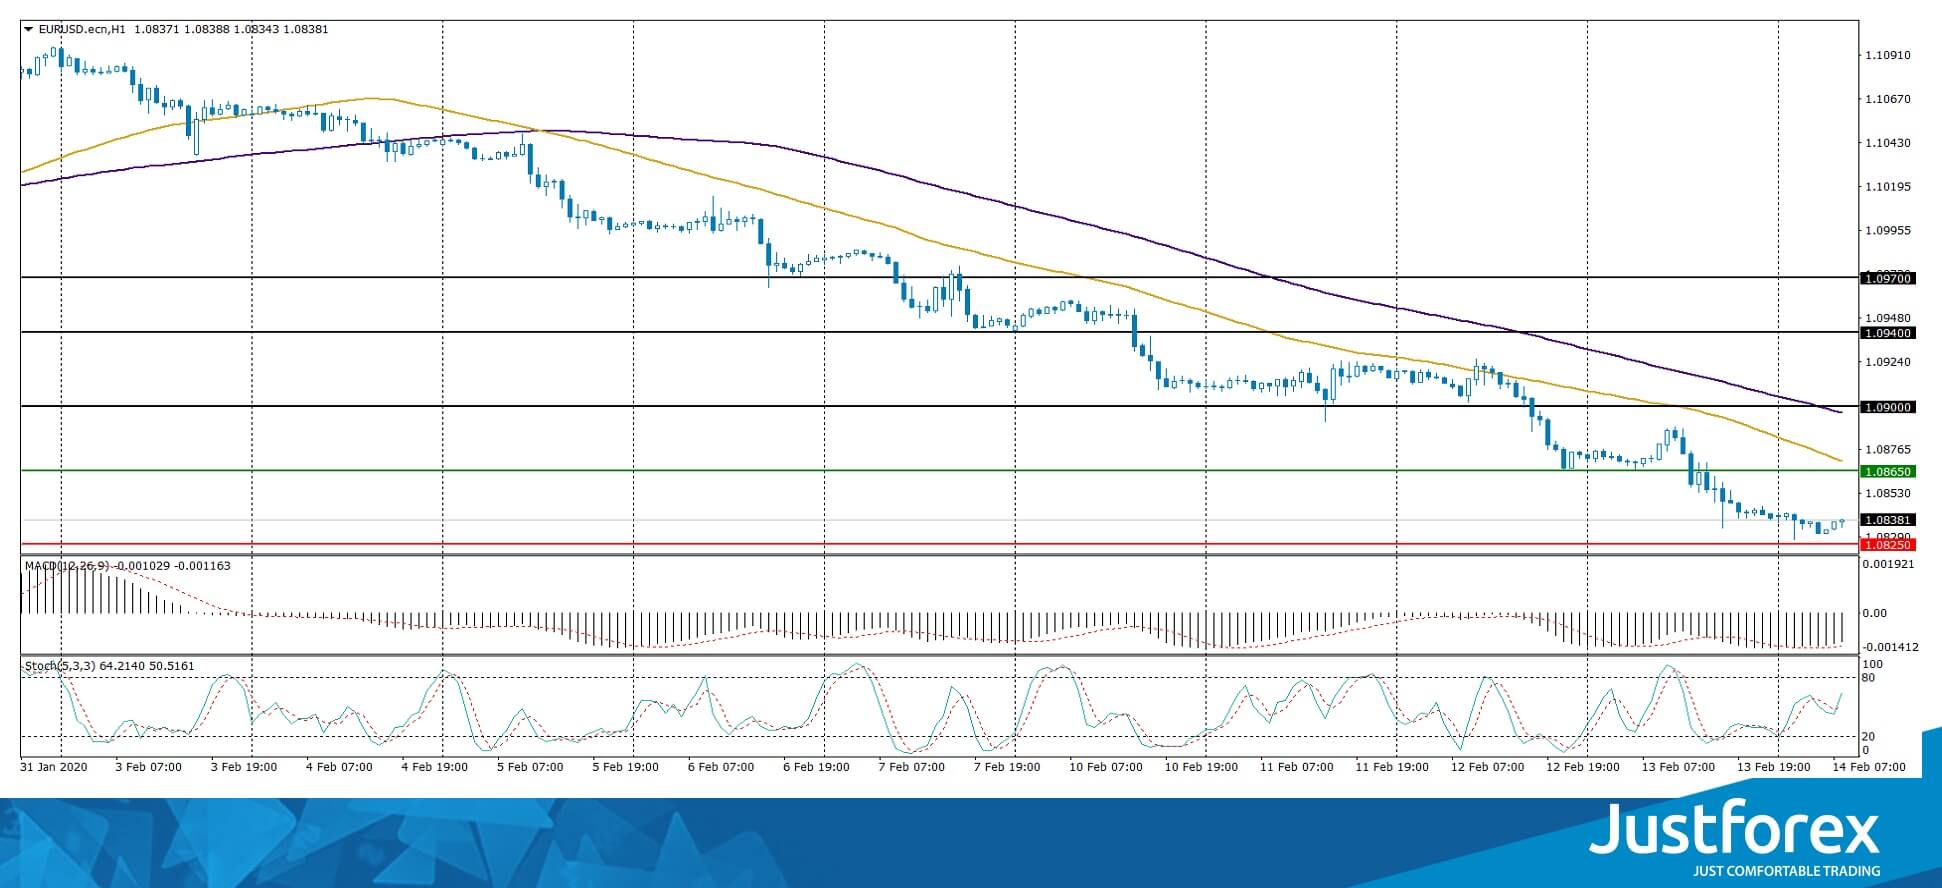
The indicators signal the sellers’ strength: the price has fixed below 50 MA and 100 MA.
The MACD histogram is in the negative zone, which indicates a bearish sentiment.
The Stochastic Oscillator is in the neutral zone, the %K line has crossed the %D line. There are no signals at the moment.
Trading recommendations
Support levels: 1.08250, 1.08000
Resistance levels: 1.08650, 1.09000, 1.09400
If the price fixes below 1.08250, expect further decline toward 1.08000-1.07700.
Alternatively, the quotes could grow toward 1.09000-1.09200.
The GBP/USD currency pair
Technical indicators of the currency pair:
Prev Open: 1.29597
Open: 1.30422
% chg. over the last day: +0.65
Day’s range: 1.30368 – 1.30555
52 wk range: 1.1959 – 1.3516
GBP/USD quotes have moved up. Yesterday, GBP added more than 80 points in the price against USD. The trading instrument has updated the local highs. At the moment GBP/USD currency pair is consolidating. The key range is 1.30100-1.30650. The technical patterb signals the further recovery of GBP/USD quotes. We expect important economic reports from the USA. Positions should be opened from key levels.
The news background on the UK economy is calm.
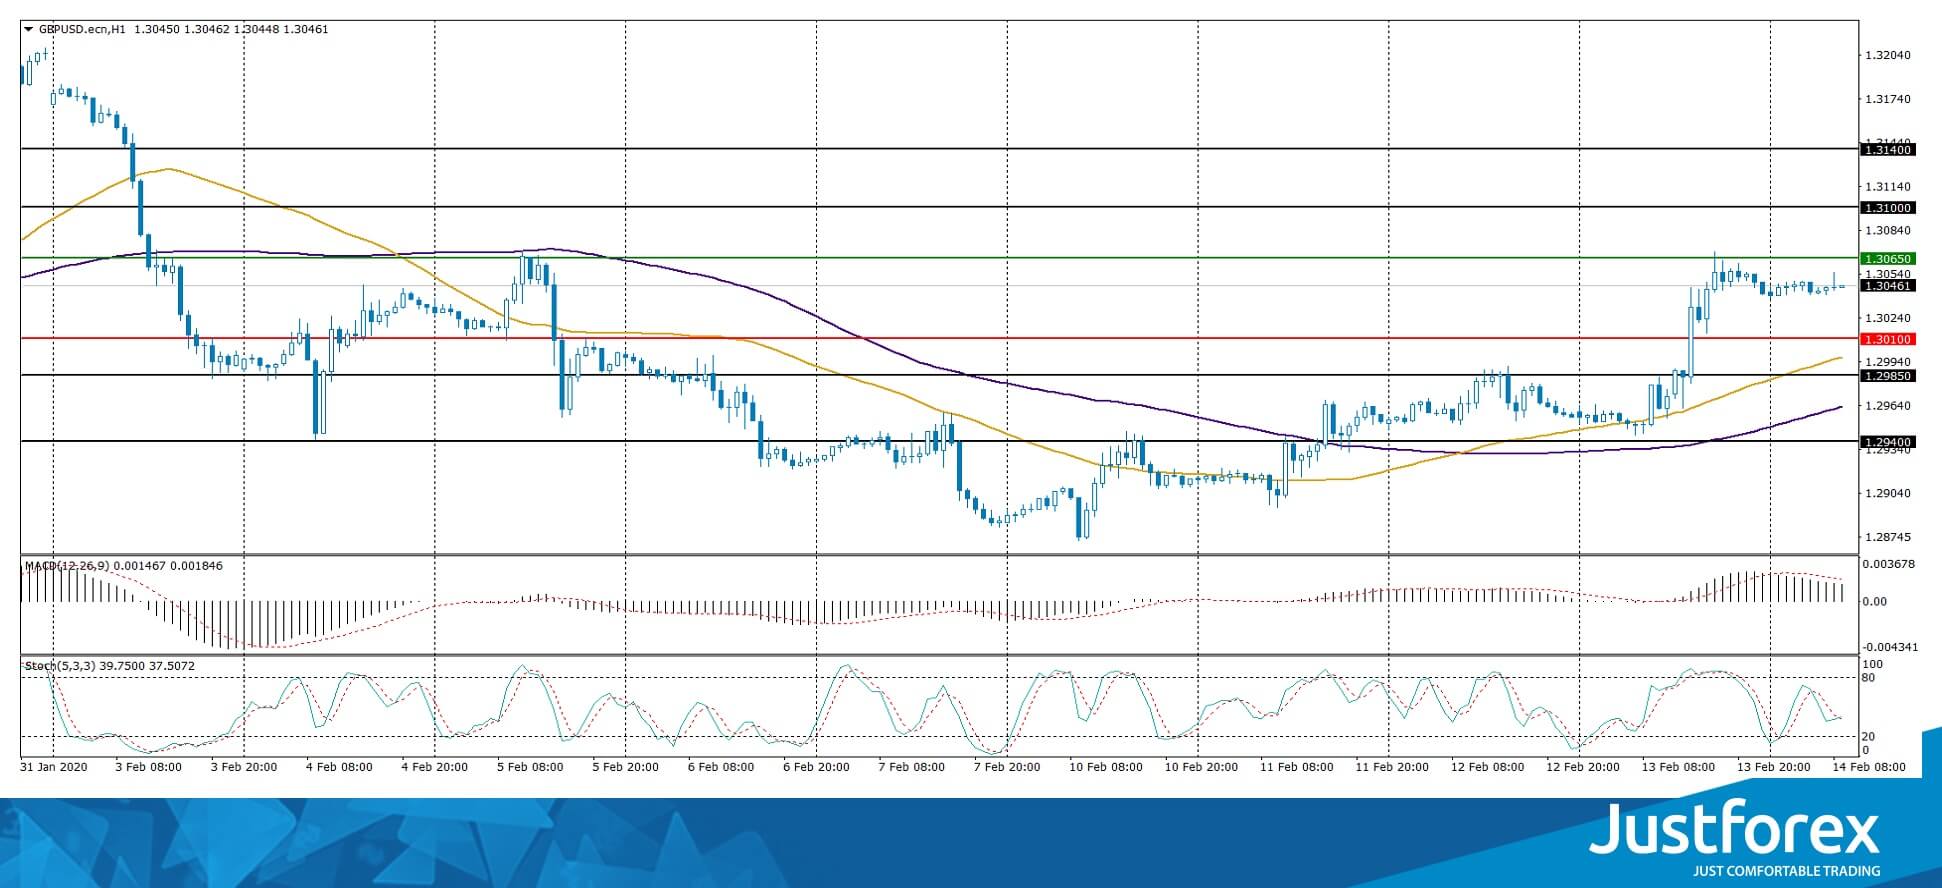
The indicators point to the strength of buyers: the price has fixed above 50 MA and 100 MA.
MACD histogram is in the positive zone, but below the signal line, which gives a weak signal to buy GBP/USD.
The Stochastic Oscillator is located in the neutral zone, the %K line crossed the %D line. There are no signals at the moment.
Trading recommendations
Support levels: 1.30100, 1.29850, 1.29400
Resistance levels: 1.30650, 1.31000, 1.31400
If the price fixes above 1.30650, expect further growth toward 1.31000-1.31400.
Alternatively, the quotes could descend toward 1.29700-1.29500.
The USD/CAD currency pair
Technical indicators of the currency pair:
Prev Open: 1.32516
Open: 1.32665
% chg. over the last day: +0.10
Day’s range: 1.32541 – 1.32690
52 wk range: 1.2949 – 1.3566
The USD/CAD currency pair is moving sideways. There is no defined trend. The investors are waiting for additional drivers. The trading instrument tests local support and resistance levels at 1.32400 and 1.32700, respectively. USD/CAD quotes can decline further. Today we recommend paying attention to the economic releases from the USA, as well as the dynamics of oil prices. Positions should be opened from key levels.
The publication of important statistical data from Canada is not planned.
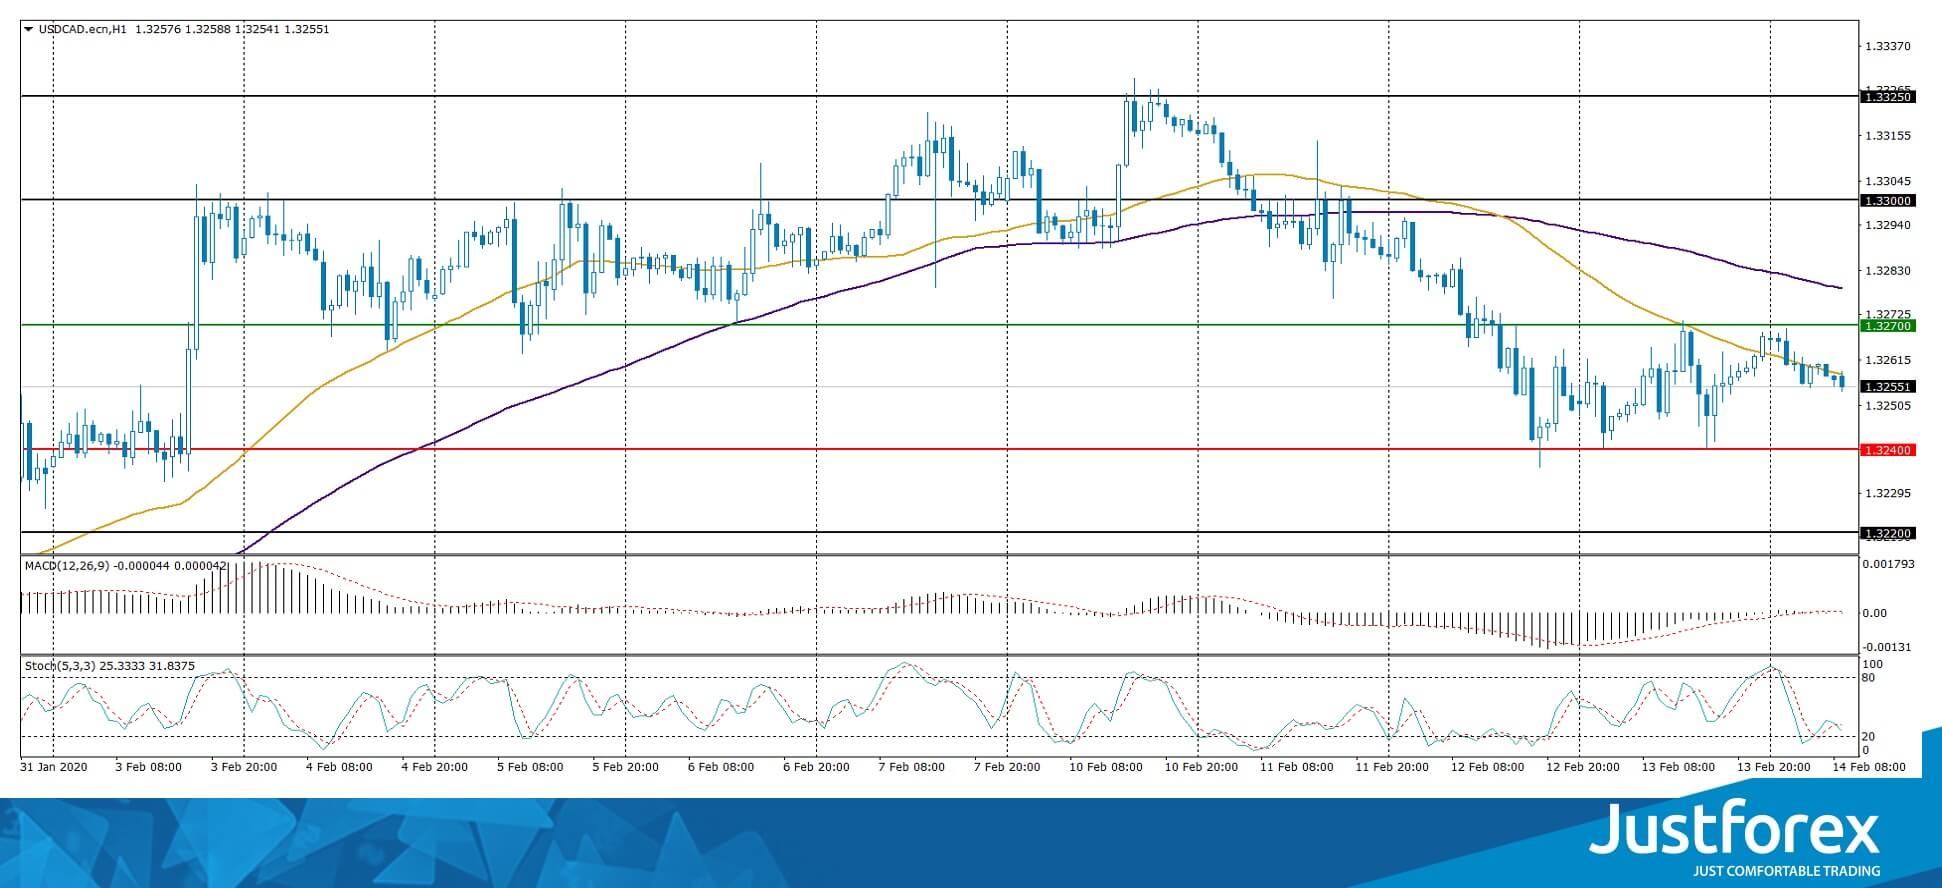
Indicators do not give accurate signals: the price has crossed 50 MA.
MACD histogram is near the 0 mark.
The Stochastic Oscillator is located in the neutral zone, the %K line has crossed the %D line. There are no signals at the moment.
Trading recommendations
Support levels: 1.32400, 1.32200, 1.31900
Resistance levels: 1.32700, 1.33000, 1.33250
If the price fixes below 1.32400, expect further correction toward 1.32000.
Alternatively, the quotes could grow toward 1.32900-1.33100.
The USD/JPY currency pair
Technical indicators of the currency pair:
Prev Open: 110.071
Open: 109.813
% chg. over the last day: -0.28
Day’s range: 109.730 – 109.912
52 wk range: 104.45 – 113.53
USD/JPY currency pair continues to trade in a flat. The technical pattern is ambiguous. The trading instrument tests the local supply and demand zones at 109.550-109.700 and 110.000-110.150, respectively. Investors are still concerned about the further spread of coronavirus from China, which supports the demand for safe haven currencies. Today the focus is on the US economy statistics. We recommend opening positions from key levels.
The news background on the Japanese economy is calm.
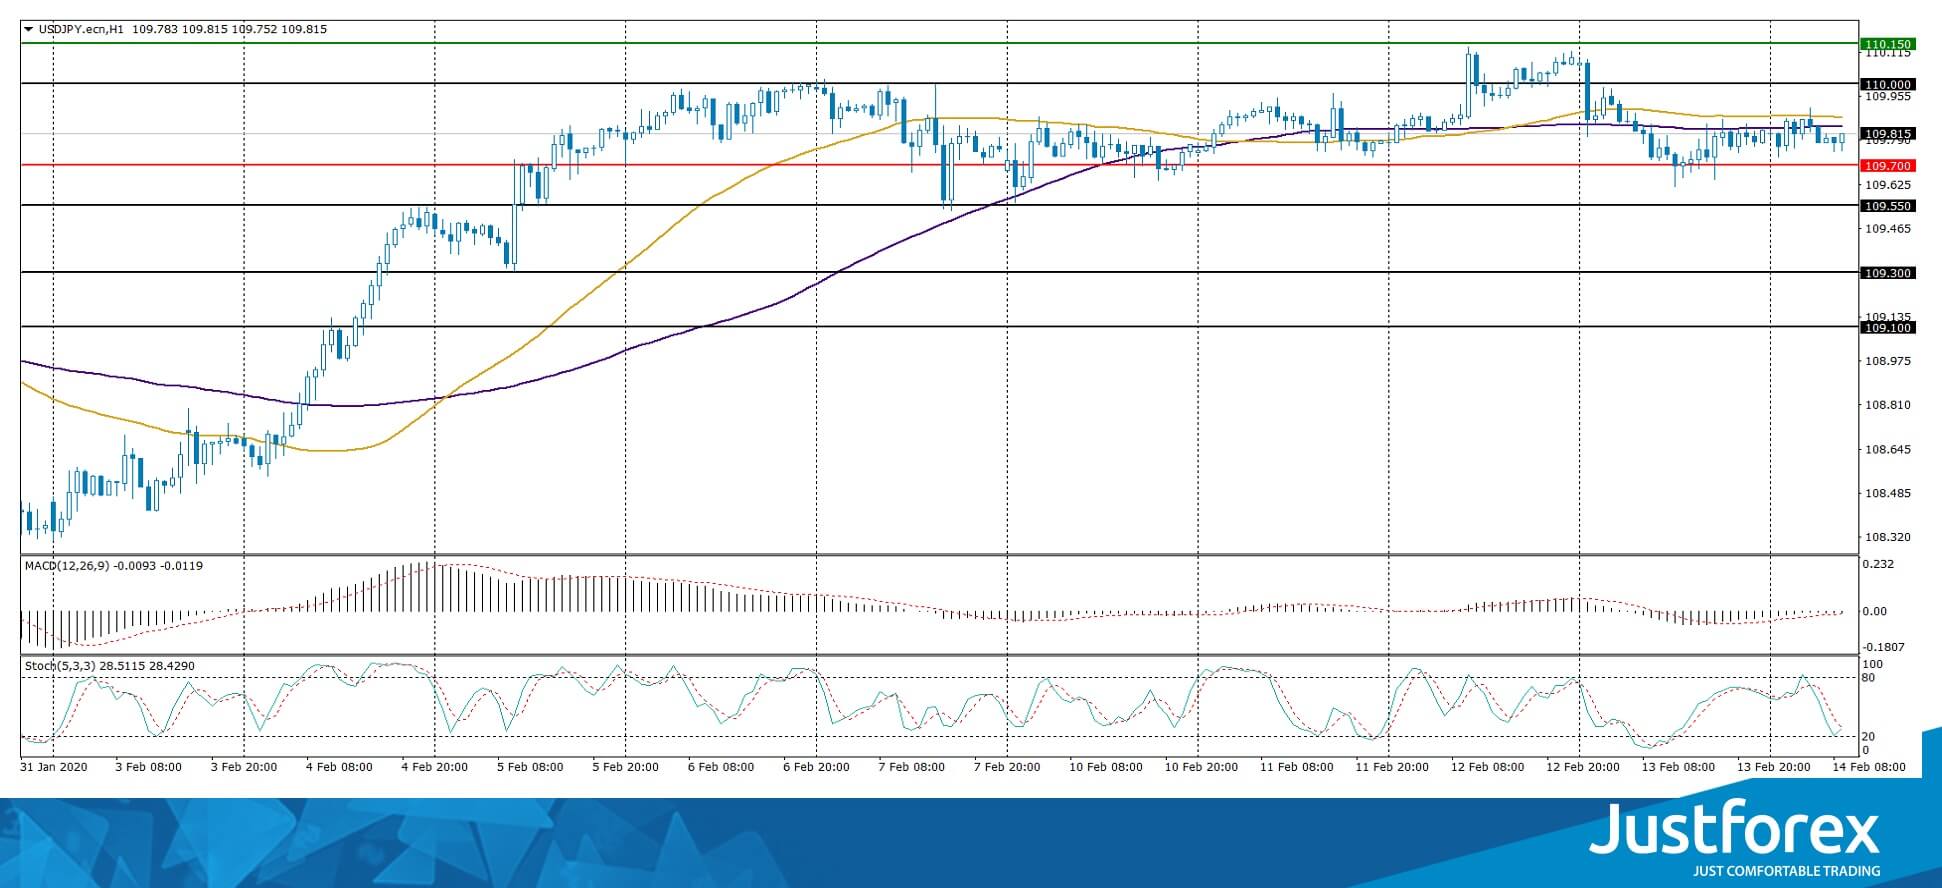
Indicators do not give an accurate signal: 50 MA crossed 100 MA.
MACD histogram is near the 0 mark. No signals at the moment.
The Stochastic Oscillator is in the neutral zone, the %K line has crossed the %D line. There are no signals at the moment.
Trading recommendations
Support levels: 109.700, 109.550, 109.300
Resistance levels: 110.150, 110.400
If the price fixes below 109.700, consider selling USD/JPY, the price will be moving toward 109.400-109.200.
Alternatively, the quotes could grow toward 110.250-110.400.


