
The EUR/USD currency pair
Technical indicators of the currency pair:
Prev Open: 1.08334
Open: 1.07909
% chg. over the last day: -0.38
Day’s range: 1.07902 – 1.08037
52 wk range: 1.0879 – 1.1572
EUR/USD quotes continue to show a steady downtrend. The trading instrument has renewed its three-year lows against greenback. The euro continues to be under pressure from the flow of weak economic releases. Currently, EUR/USD currency pair is consolidating in the range of 1.07850-1.08250. Participants of the financial markets expect the publication of FOMC protocols, as well as a number of important statistical data on the U.S. economy. We recommend opening positions from key levels.
The Economic News Feed for 19.02.2020:
Manufacturer Price Index (US) – 15:30 (GMT+2:00);
Real Estate Market Report (US) – 15:30 (GMT+2:00);
FOMC Minutes Publication (US) – 21:00 (GMT+2:00);
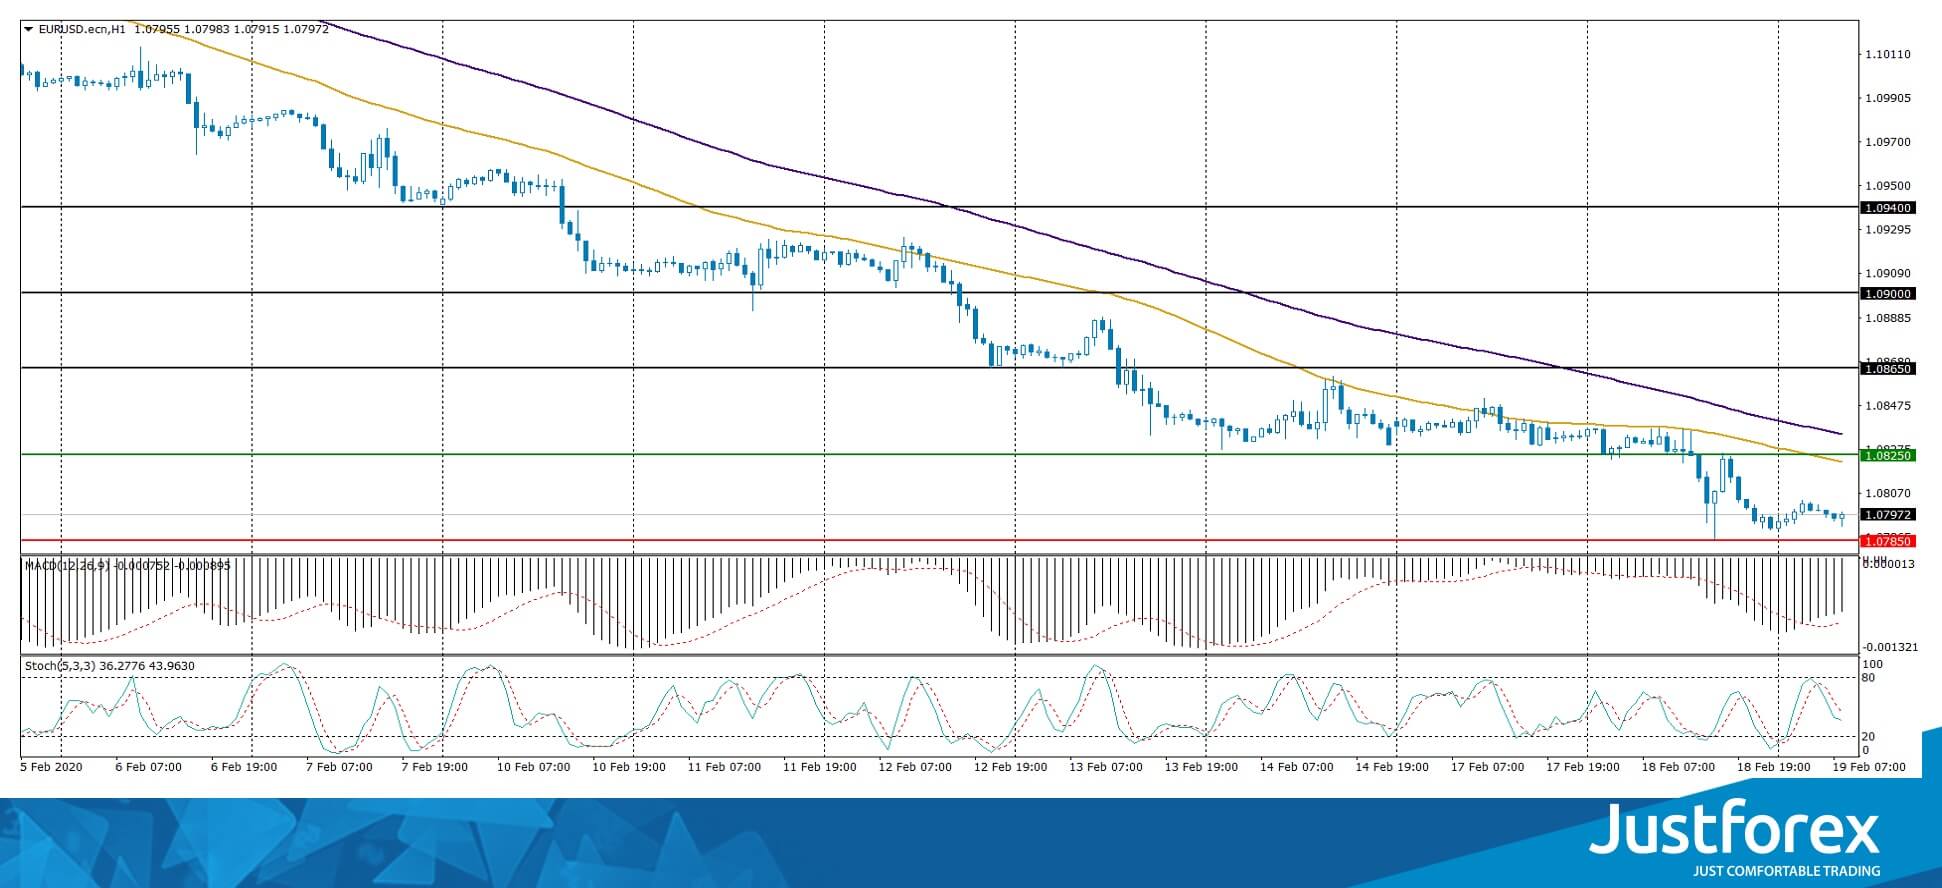
The indicators signal the sellers’ strength: the price has fixed below 50 MA and 100 MA.
The MACD histogram is in the negative zone, which indicates a bearish sentiment.
The Stochastic Oscillator is in the neutral zone, the %K line is below the %D line, which also gives a sell signal for EUR/USD.
Trading recommendations
Support levels: 1.07850, 1.07500
Resistance levels: 1.08250, 1.08650, 1.09000
If the price fixes below 1.07850, further decline of EUR/USD quotes is expected. Potential of movement to 1.07500-1.07300.
Alternatively the quotes could grow to to 1.08600-1.08800.
The GBP/USD currency pair
Technical indicators of the currency pair:
Prev Open: 1.30033
Open: 1.29988
% chg. over the last day: -0.08
Day’s range: 1.29871 – 1.30048
52 wk range: 1.1959 – 1.3516
The technical pattern on the GBP/USD currency pair is ambiguous. GBP is moving sideways, there is no defined trend. At the moment, local support and resistance levels are at 1.29750 and 1.30150, respectively. Financial markets participants are waiting for important economic reports from the UK and USA. Positions should be opened from key levels.
At 11:30 (GMT+2:00) the UK inflation data will be published.
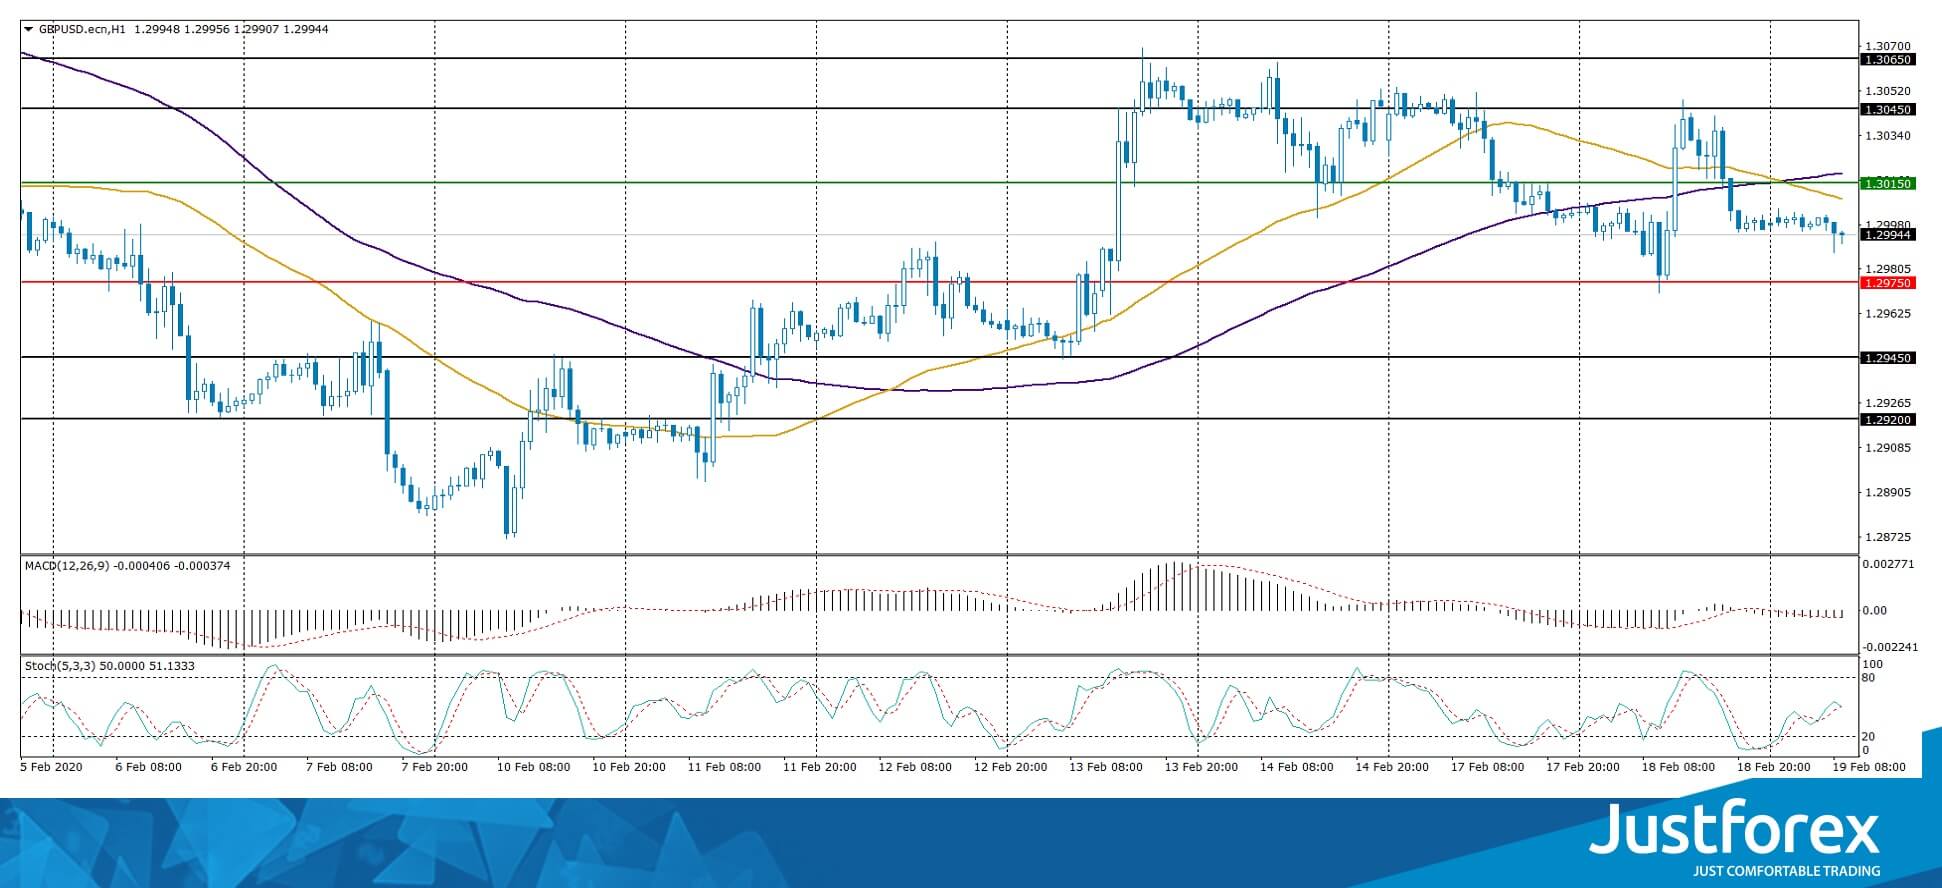
Indicators do not give an accurate signal: 50 MA crossed 100 MA.
The MACD histogram has crossed the negative zone, which gives a sell signal for GBP/USD.
The Stochastic Oscillator is located in the neutral zone, the %K line has crossed the %D line. There are no signals at the moment.
Trading recommendations
Support levels: 1.29750, 1.29450, 1.29200
Resistance levels: 1.30150, 1.30450, 1.30650
If the price fixes below 1.29750, expect the quotes to fall toward 1.29450-1.29200.
Alternatively, the quotes could grow toward 1.30450-1.30700.
The USD/CAD currency pair
Technical indicators of the currency pair:
Prev Open: 1.32330
Open: 1.32606
% chg. over the last day: +0.15
Day’s range: 1.32417 – 1.32606
52 wk range: 1.2949 – 1.3566
USD/CAD keeps being traded in a long flute. There is no unidirectional trend. At the moment, local support and resistance levels are at 1.32400 and 1.32600, respectively. USD/CAD quotes have a downside potential. Today, investors will appreciate important economic releases from Canada and USA. We also recommend to pay attention to the dynamics of oil prices. Positions should be opened from key levels.
At 15:30 (GMT+2:00) the inflation data for Canada will be published.
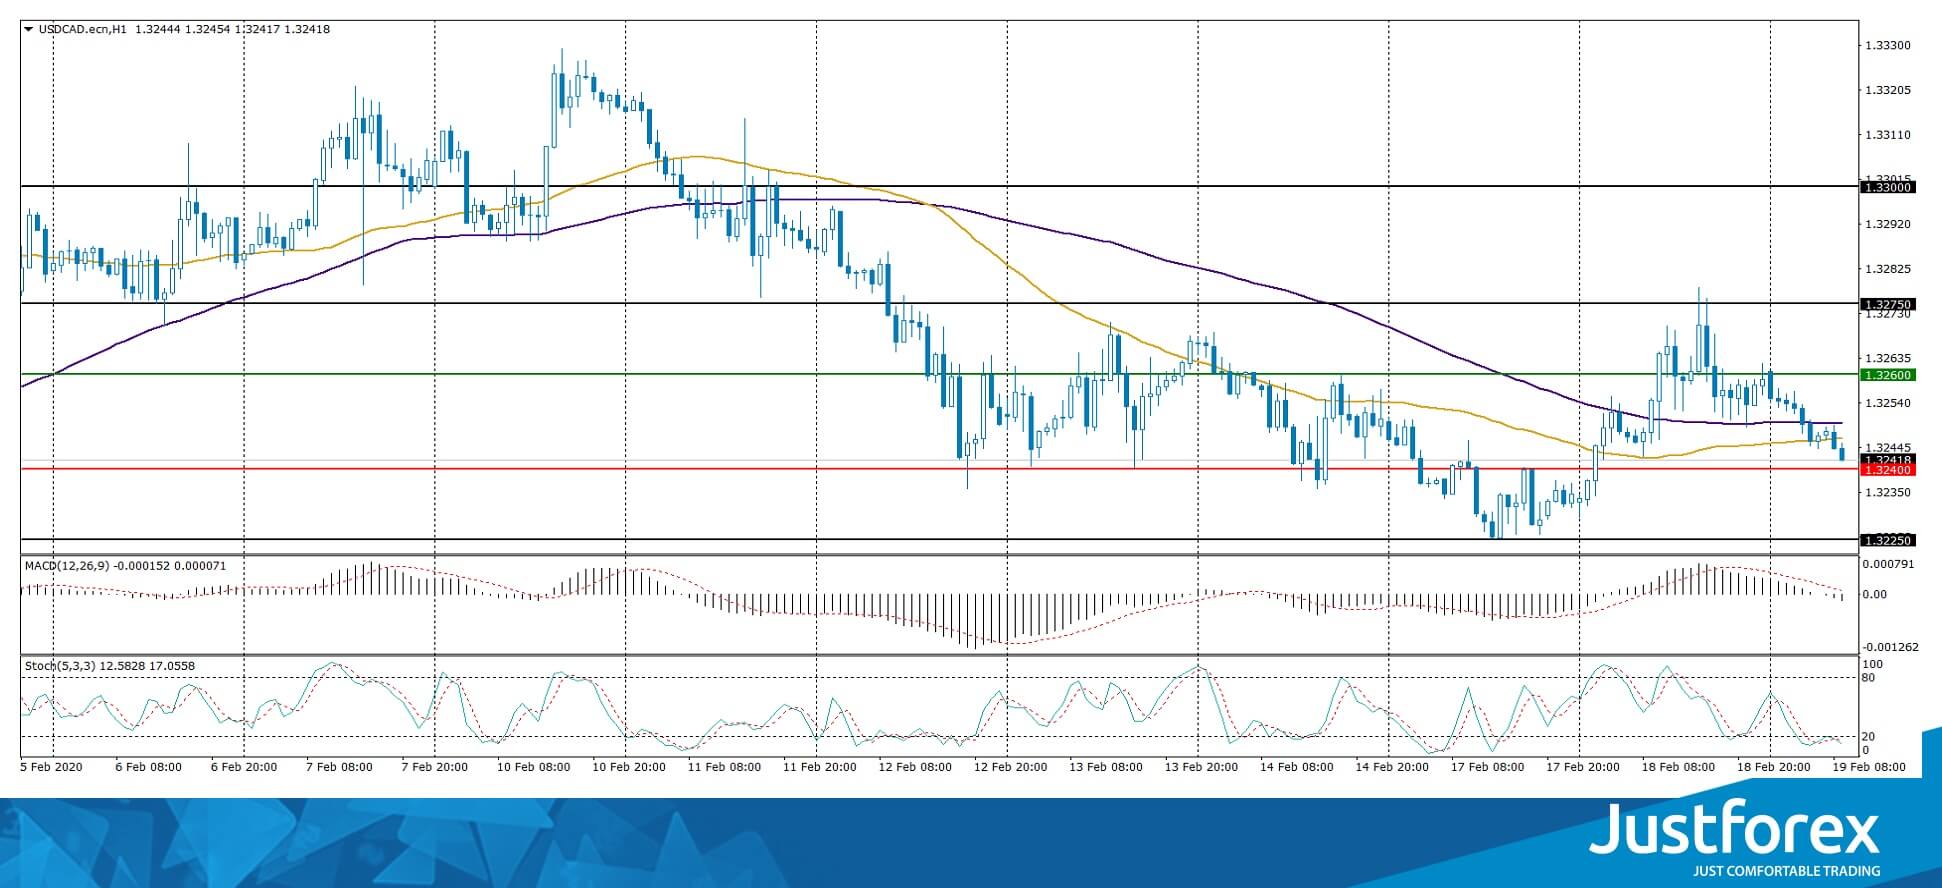
Indicators do not give accurate signals: the price has crossed 50 MA and 100 MA.
MACD has crossed to the negative zone, which indicates the development of bearish sentiments.
The Stochastic Oscillator is located in the oversold area, the %K line has crossed the %D line. No signals at the moment.
Trading recommendations
Support levels: 1.32400, 1.32250, 1.32000
Resistance levels: 1.32600, 1.32750, 1.33000
If the price fixes below 1.32400, expect the quotes to fall toward 1.32000.
Alternatively, the quotes will grow toward 1.32750-1.33000.
The USD/JPY currency pair
Technical indicators of the currency pair:
Prev Open: 109.876
Open: 109.869
% chg. over the last day: -0.01
Day’s range: 109.847 – 110.113
52 wk range: 104.45 – 113.53
The USD/JPY currency pair has moved up. The trading instrument reached the key extremums. At the moment USD/JPY is consolidating near the resistance level of 110.100. The mark 109.900 is the nearest support. The participants of financial markets took a waiting position before the publication of FOMC protocols. We also recommend you to pay attention to the US government bond yield dynamics. Positions should be opened from key levels.
The Economic News Feed for 19.02.2020 is calm.
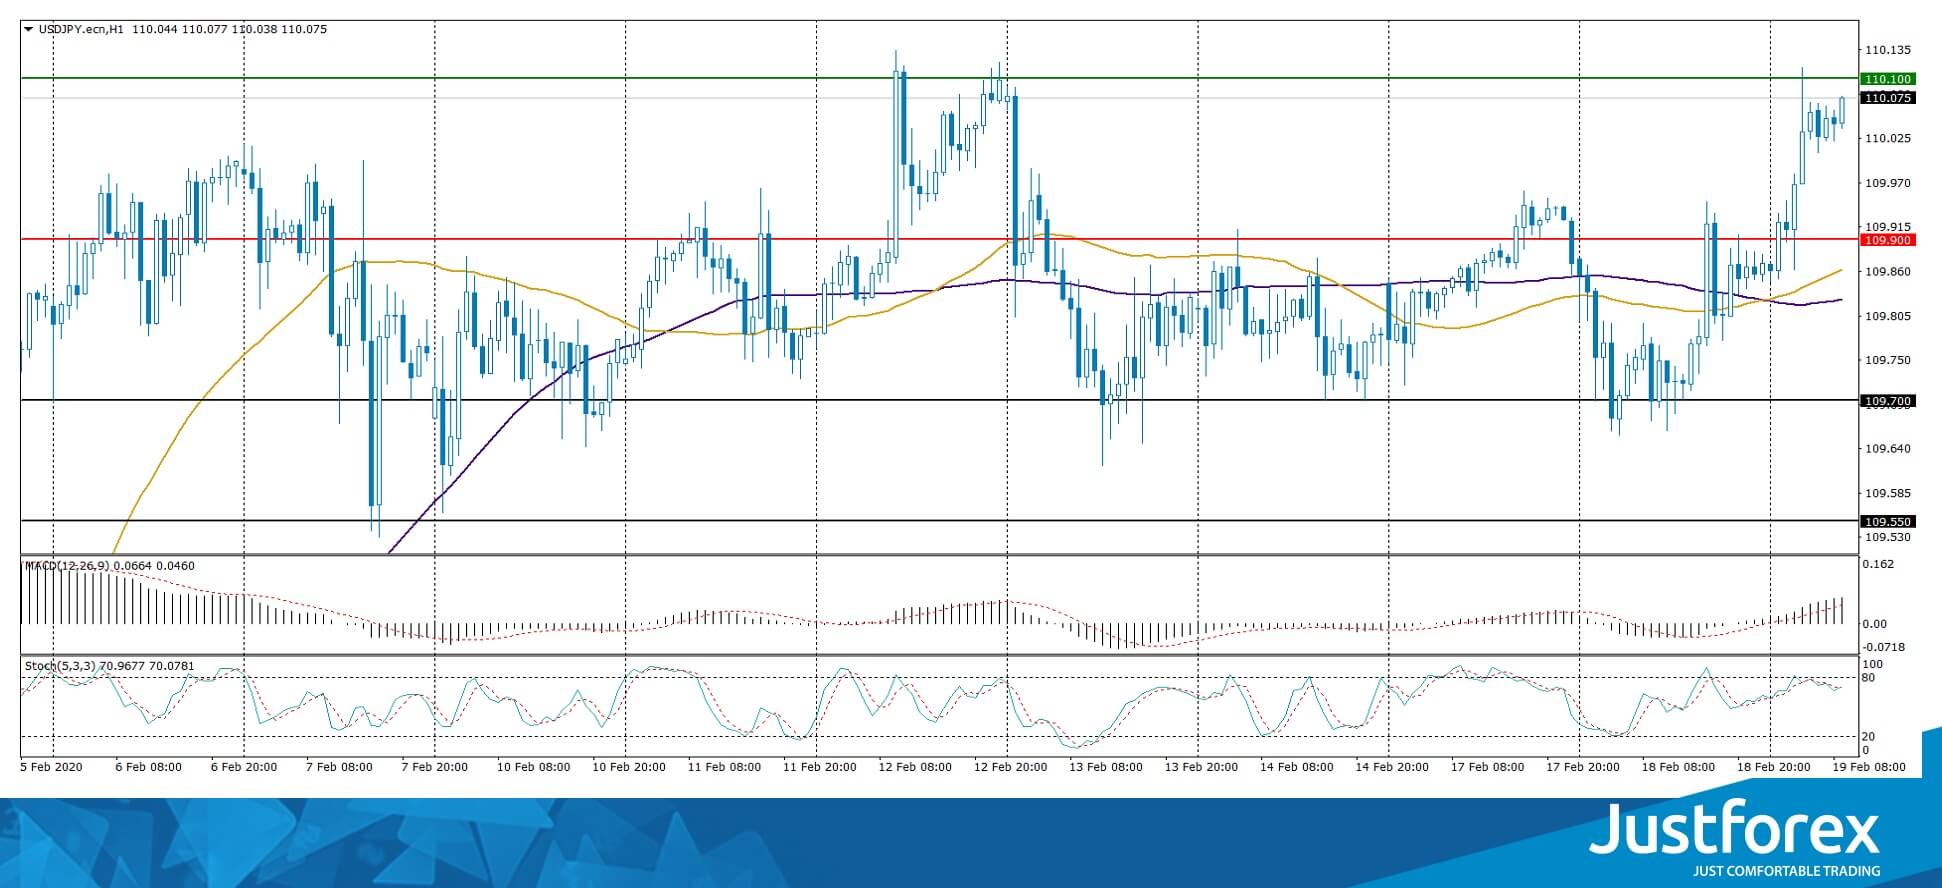
The indicators signal the strength of buyers: the price has fixed above 50 MA and 100 MA.
MACD histogram is in the positive zone, which indicates a bullish sentiment.
The Stochastic Oscillator is in the neutral zone, the %K line crosses the %D line. No signals at the moment.
Trading recommendations
Support levels: 109.900, 109.700, 109.550
Resistance levels: 110.100, 110.400
If the price fixes above 110.100, USD/JPY purchases should be considered. Potential movement towards 110.400-110.600.
Alternatively, the USD/JPY pair may decline to 109.700-109.550.


