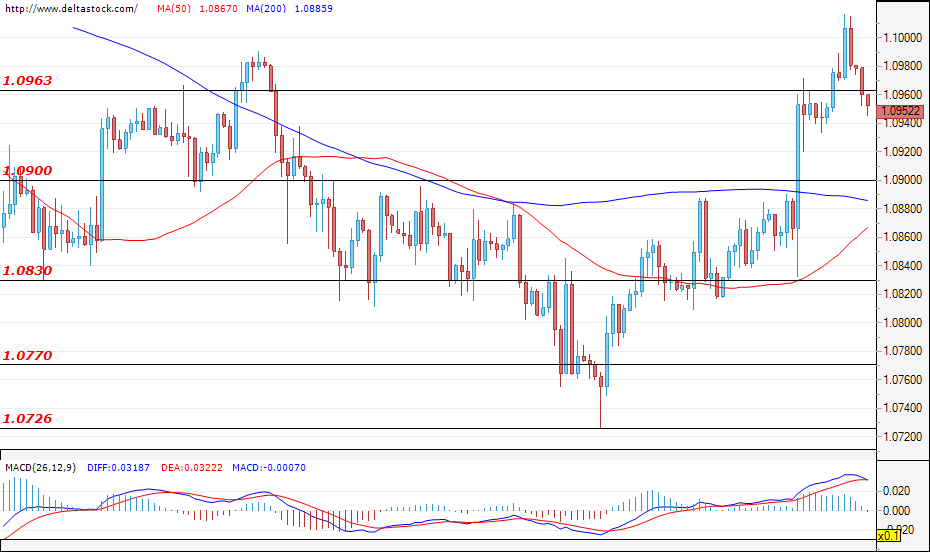
EUR/USD
Current level – 1.0952
Bears took control at the start of today’s trading and the EUR/USD easily broke through the support zone at 1.0963. If the pair stays below the aforementioned, the more likely scenario will be a test of the support at 1.0900. An increase in negative momentum could lead to erasing the gains from last week and the EUR/USD could return to the 1.0830-1.0900 range. However, if the bulls manage to stage a comeback and violate 1.0963, we could witness a new rally and test of the resistance zone at 1.1032.
| Resistance | Support | ||
| intraday | intraweek | intraday | intraweek |
| 1.0963 | 1.0960 | 1.0900 | 1.0650 |
| 1.1032 | 1.1030 | 1.0830 | 1.0570 |
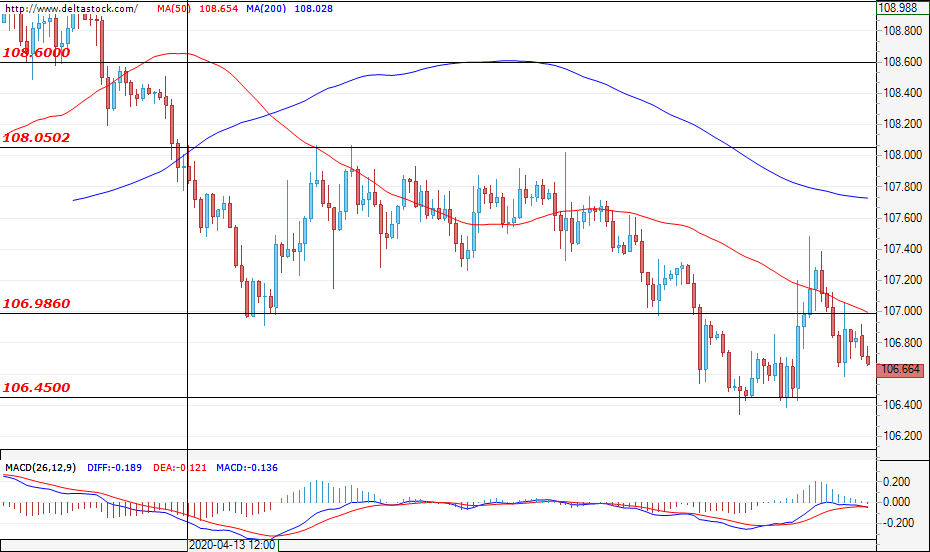
USD/JPY
Current level – 106.66
The resistance level at 107.00 successfully held the attempts for a breach and the currency pair consolidated around the current price at 106.66. Further decrease could show negative sentiments of the market participants and lead the USD to new losses against the JPY, towards the lows at 106.48, targeting the support levels from March around 105.09. In the upward direction, a successful breakthrough of the resistance zone at 107.00 could help the bulls push the USD/JPY higher, towards a test of the next resistance zone at 108.05.
| Resistance | Support | ||
| intraday | intraweek | intraday | intraweek |
| 107.00 | 109.25 | 106.00 | 103.40 |
| 108.00 | 111.50 | 105.60 | 103.40 |
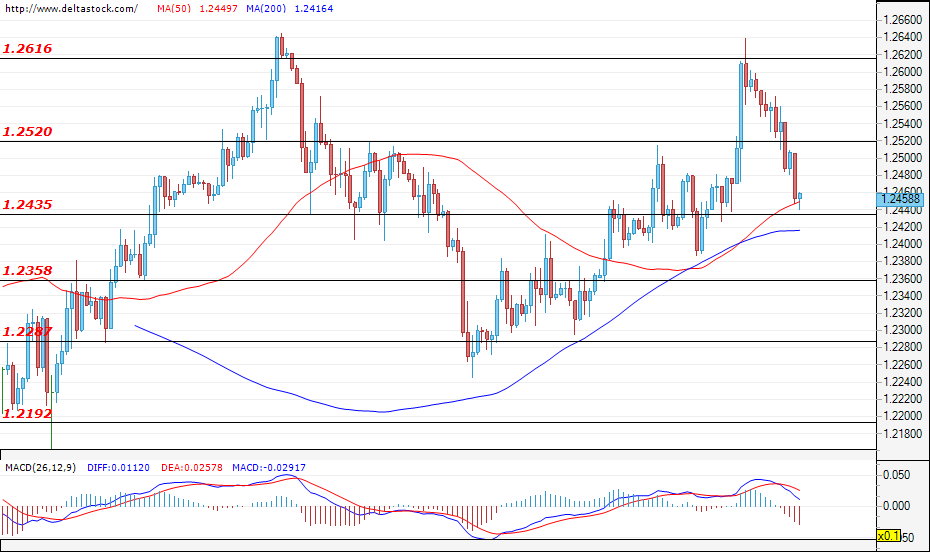
GBP/USD
Current level – 1.2458
The GBP continues to lose ground against the USD and at the moment of writing is about to test the support zone at 1.2435. A successful breach could pave the way to the next target at 1.2358 or the lower one at 1.2287 and show that sentiment is turning negative. If bulls reenter the market, the first resistance zone lies at 1.2520, followed by the previously reached high at 1.2616. High volatility is expected on Thursday, when the Bank of England’s Interest Rate decision is to be released.
| Resistance | Support | ||
| intraday | intraweek | intraday | intraweek |
| 1.2470 | 1.2620 | 1.2435 | 1.2190 |
| 1.2520 | 1.2830 | 1.2360 | 1.1800 |