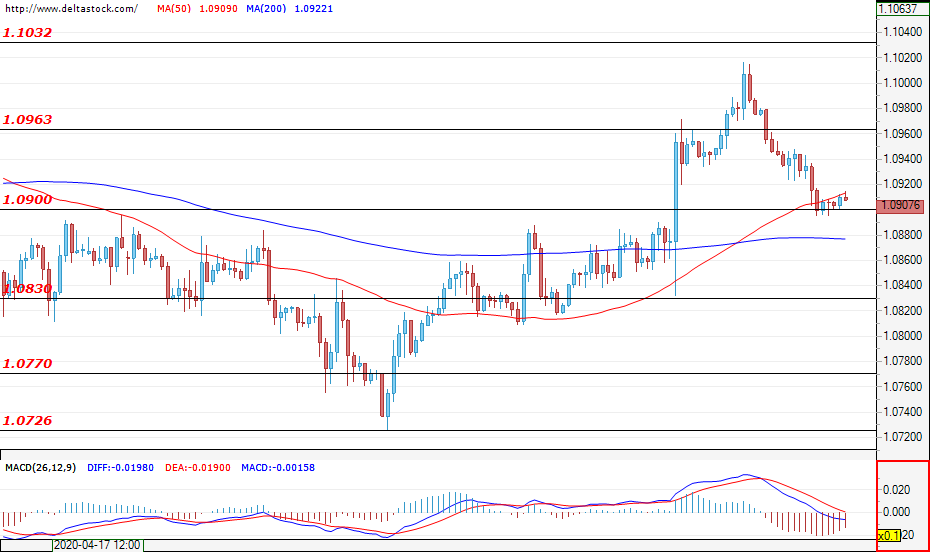
EUR/USD
Current level – 1.0907
At the time of writing the analysis, the currency pair is trading just above the support level at 1.0900 after failing to break it. The most likely scenario is for a successful break of the mentioned support area due to the uncertainty of the bulls around the 1.0960 area, the recent unsuccessful attempt to reach 1.1030, and the increase in bearish sentiment during this week’s first trading session. If 1.0900 is violated, the next support is the 1.0830 level, a successful breakthrough of which would lead to an increased selling pressure.
| Resistance | Support | ||
| intraday | intraweek | intraday | intraweek |
| 1.0960 | 1.1030 | 1.0900 | 1.0730 |
| 1.1030 | 1.1140 | 1.0830 | 1.0560 |
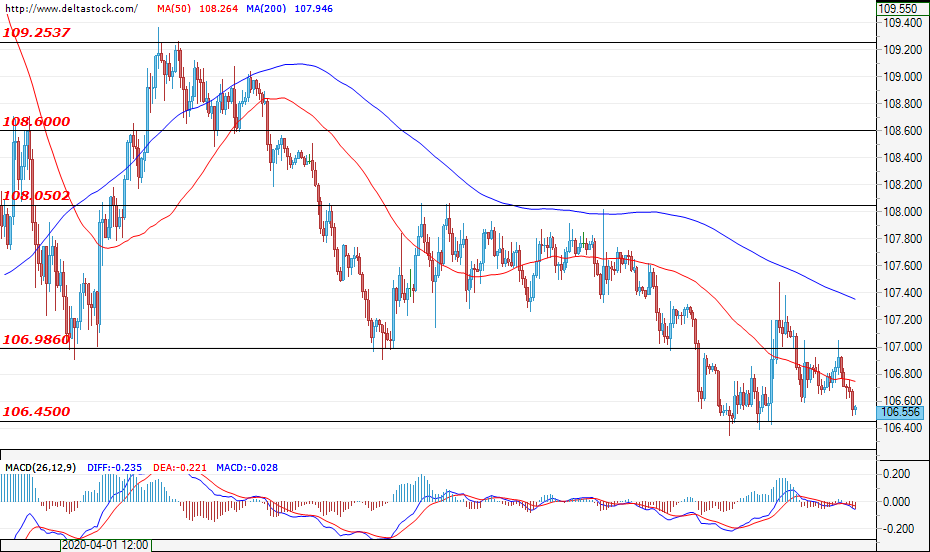
USD/JPY
Current level – 106.55
The upward movement was limited up to the resistance at 107.00 as the currency pair continues to trade in the narrow range of 106.45-107.00. A break at one of the borders of the mentioned channel would determine the future movement of the currency pair. There is currently no significant economic data which could substantially impact the Japanese Yen during today’s trading session.
| Resistance | Support | ||
| intraday | intraweek | intraday | intraweek |
| 107.00 | 109.25 | 106.45 | 103.40 |
| 108.00 | 111.50 | 105.60 | 103.40 |
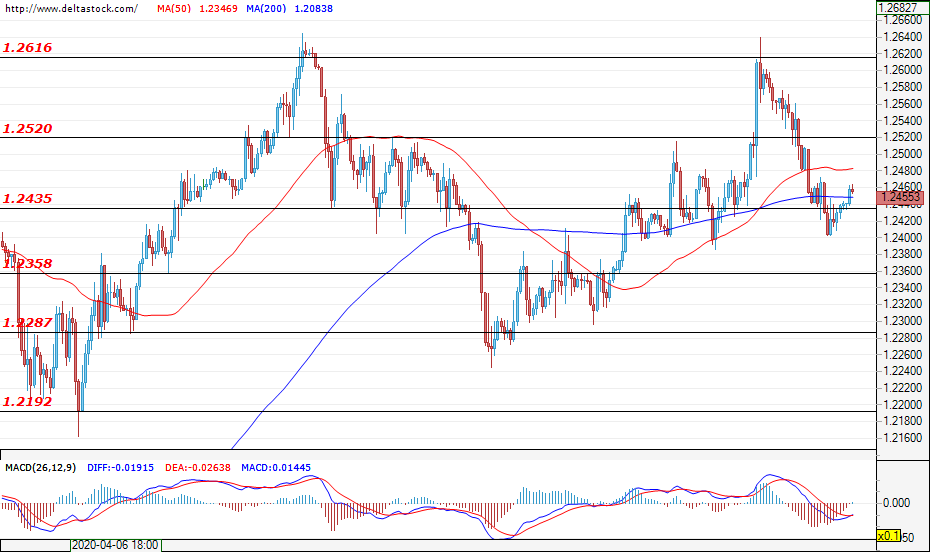
GBP/USD
Current level – 1.2455
The GBP managed to regain some of its lost positions against the US dollar and at the time of writing is trading just above the support zone at 1.243. In downward direction, the breakthrough at the aforementioned level from the last trading session was fleeting and cannot be considered as completed. However, if the pair manages to successfully break 1.243, investor sentiments will be negatively impacted and we can expect a test of the next support area at 1.2360. As per the large time frames, only a breakthrough at the resistance level of 1.2615 would signal a change in investors’ attitude towards the GBP.
| Resistance | Support | ||
| intraday | intraweek | intraday | intraweek |
| 1.2520 | 1.2615 | 1.2435 | 1.2190 |
| 1.2615 | 1.2750 | 1.2360 | 1.1800 |