XAU/USD (Gold) is moving sideways in a triangle chart pattern. The ABCDE waves (blue) are expected to be completed soon.
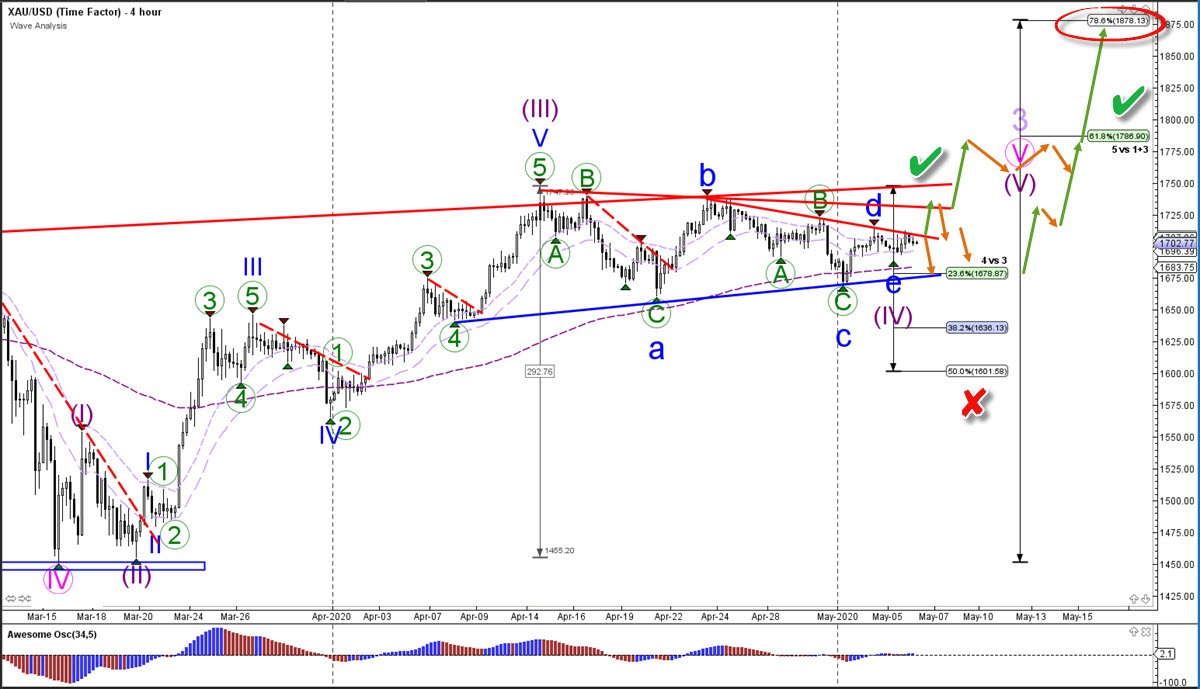
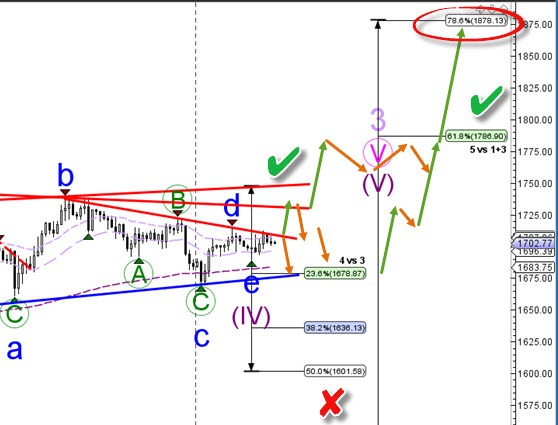
The XAU/USD (blue) could be in the final wave E (blue). Although it’s possible the price will still extend the wave D (blue) at the resistance trend line (red) and the wave E at support. The ABCDE triangle is part of a wave 4 (purple) correction. This in turn is indicating an uptrend and a continuation of wave 5 (purple) within wave 3 (purple).
The bullish target is the 78.6% Fibonacci level of wave 5 vs 1+3. Price needs to break above the resistance trend lines (red) first before a new bullish swing could take place. A break below the 50% Fib invalidates the bullish outlook.