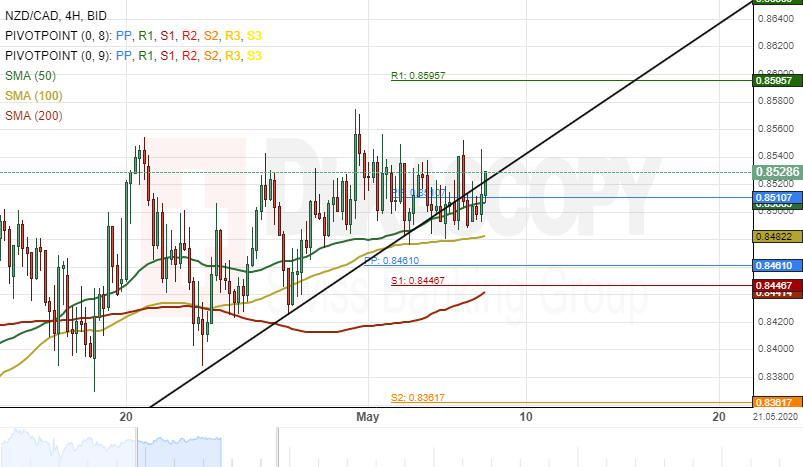
The New Zealand Dollar has surged by 144 pips or 1.72% against the Canadian Dollar since April 23. The currency pair was guided by the 100– period simple moving average.
Currently, the exchange rate is testing a support line formed by the 100– period SMA at 0.8481.
If the support line holds, the NZD/USD pair would continue to trend bullish during the following trading sessions.
However, if the currency exchange rate breaks the 100– period SMA, the next target for bearish traders could be at the 0.8400 area.