
The EUR/USD currency pair
Technical indicators of the currency pair:
Prev Open: 1.09493
Open: 1.08955
% chg. over the last day: -0.44
Day’s range: 1.08707 – 1.09087
52 wk range: 1.0777 – 1.1494
Sales prevail on the EUR/USD currency pair. The trading instrument has updated local lows. Demand for risky assets is still low enough amid rising tensions between the US and China. At the moment, EUR/USD quotes are testing the support level of 1.0870. The 1.0910 mark is already a “mirror” resistance. We expect economic releases from Germany. We recommend opening positions from key levels.
The Economic News Feed for 25.05.2020:
Germany’s GDP fell by 2.2% (q/q) in the first quarter, which met market expectations.
At 09:00 (GMT+3:00), the German IFO business climate index will be published.
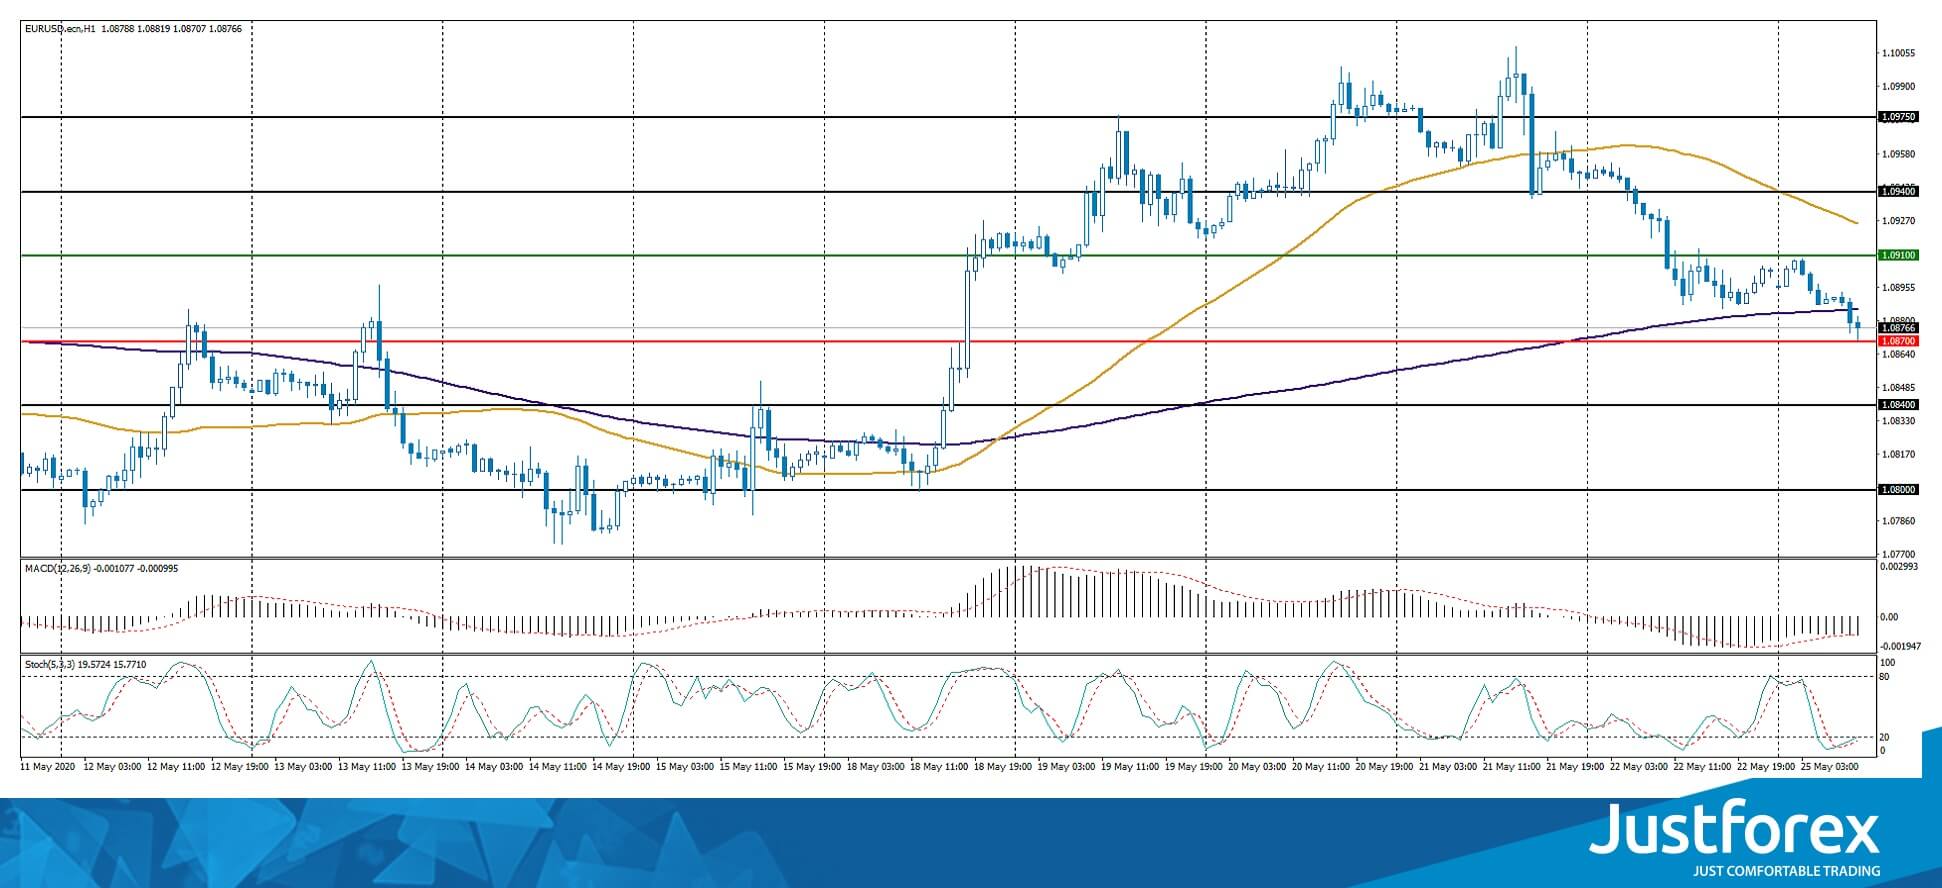
Indicators do not give accurate signals: the price has crossed 100 MA.
The MACD histogram is in the negative zone and continues to decline, which gives a strong signal to sell EUR/USD.
Stochastic Oscillator is in the oversold zone, the %K line has crossed the %D line. There are no signals at the moment.
Trading recommendations
Support levels: 1.0870, 1.0840, 1.0800
Resistance levels: 1.0910, 1.0940, 1.0975
If the price fixes below 1.0870, a further drop in EUR/USD quotes is expected. The movement is tending to 1.0840-1.0820.
An alternative could be the growth of EUR/USD quotes to 1.0930-1.0960.
The GBP/USD currency pair
Technical indicators of the currency pair:
Prev Open: 1.22153
Open: 1.21726
% chg. over the last day: -0.47
Day’s range: 1.21647 – 1.21917
52 wk range: 1.1466 – 1.3516
The GBP/USD currency pair is consolidating. The technical pattern is ambiguous. The British pound is testing local support and resistance levels: 1.2160 and 1.2210, respectively. Financial market participants expect additional drivers. The tension between Washington and Beijing has come to the fore again. We recommend opening positions from key levels.
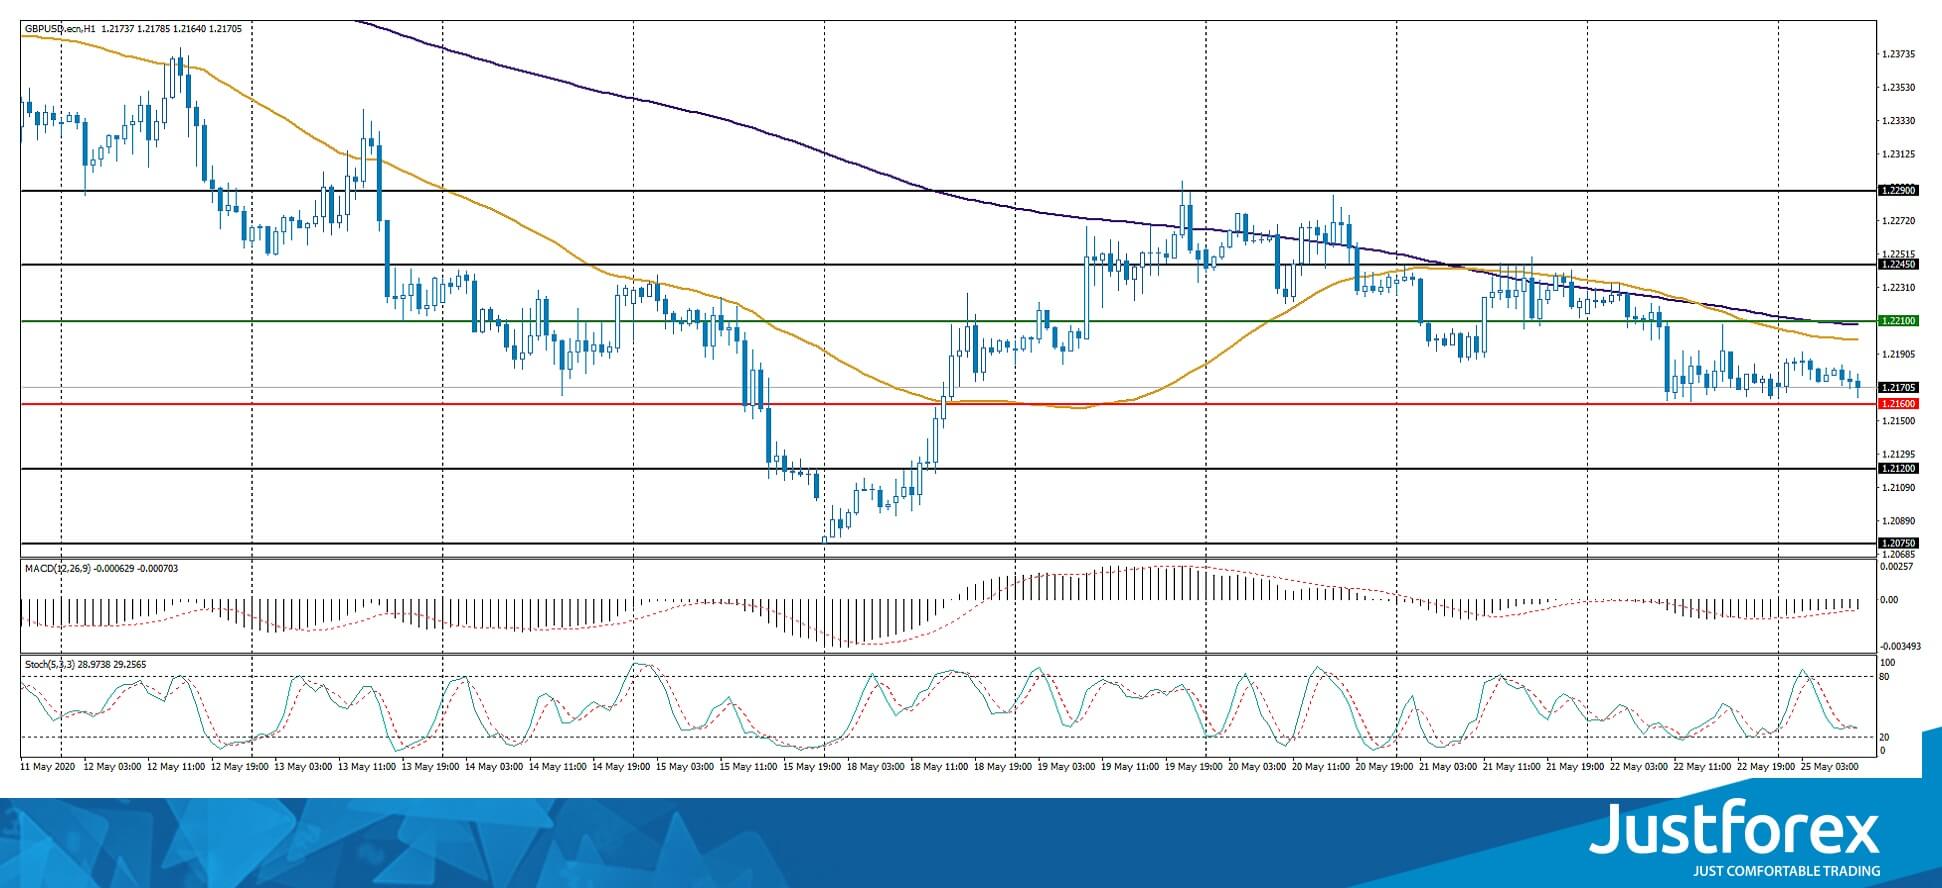
Indicators signal the power of sellers: the price has fixed below 50 MA and 100 MA.
The MACD histogram is in the negative zone, indicating the bearish sentiment.
Stochastic Oscillator is in the neutral zone, the %K line has crossed the %D line. There are no signals at the moment.
Trading recommendations
Support levels: 1.2160, 1.2120, 1.2075
Resistance levels: 1.2210, 1.2245, 1.2290
If the price fixes below 1.2160, a further drop in GBP/USD quotes is expected. The movement is tending to the round level of 1.2100.
An alternative could be the growth of the GBP/USD currency pair to 1.2240-1.2280.
The USD/CAD currency pair
Technical indicators of the currency pair:
Prev Open: 1.39549
Open: 1.39882
% chg. over the last day: +0.30
Day’s range: 1.39789 – 1.40078
52 wk range: 1.2949 – 1.4668
There is an ambiguous technical pattern on the USD/CAD currency pair. The loonie is currently consolidating. The local support and resistance levels are 1.3980 and 1.4020, respectively. Investors expect additional drivers. We recommend paying attention to the dynamics of oil quotes. Positions should be opened from key levels.
We recommend paying attention to the speech by the Governor of the Bank of Canada Poloz.
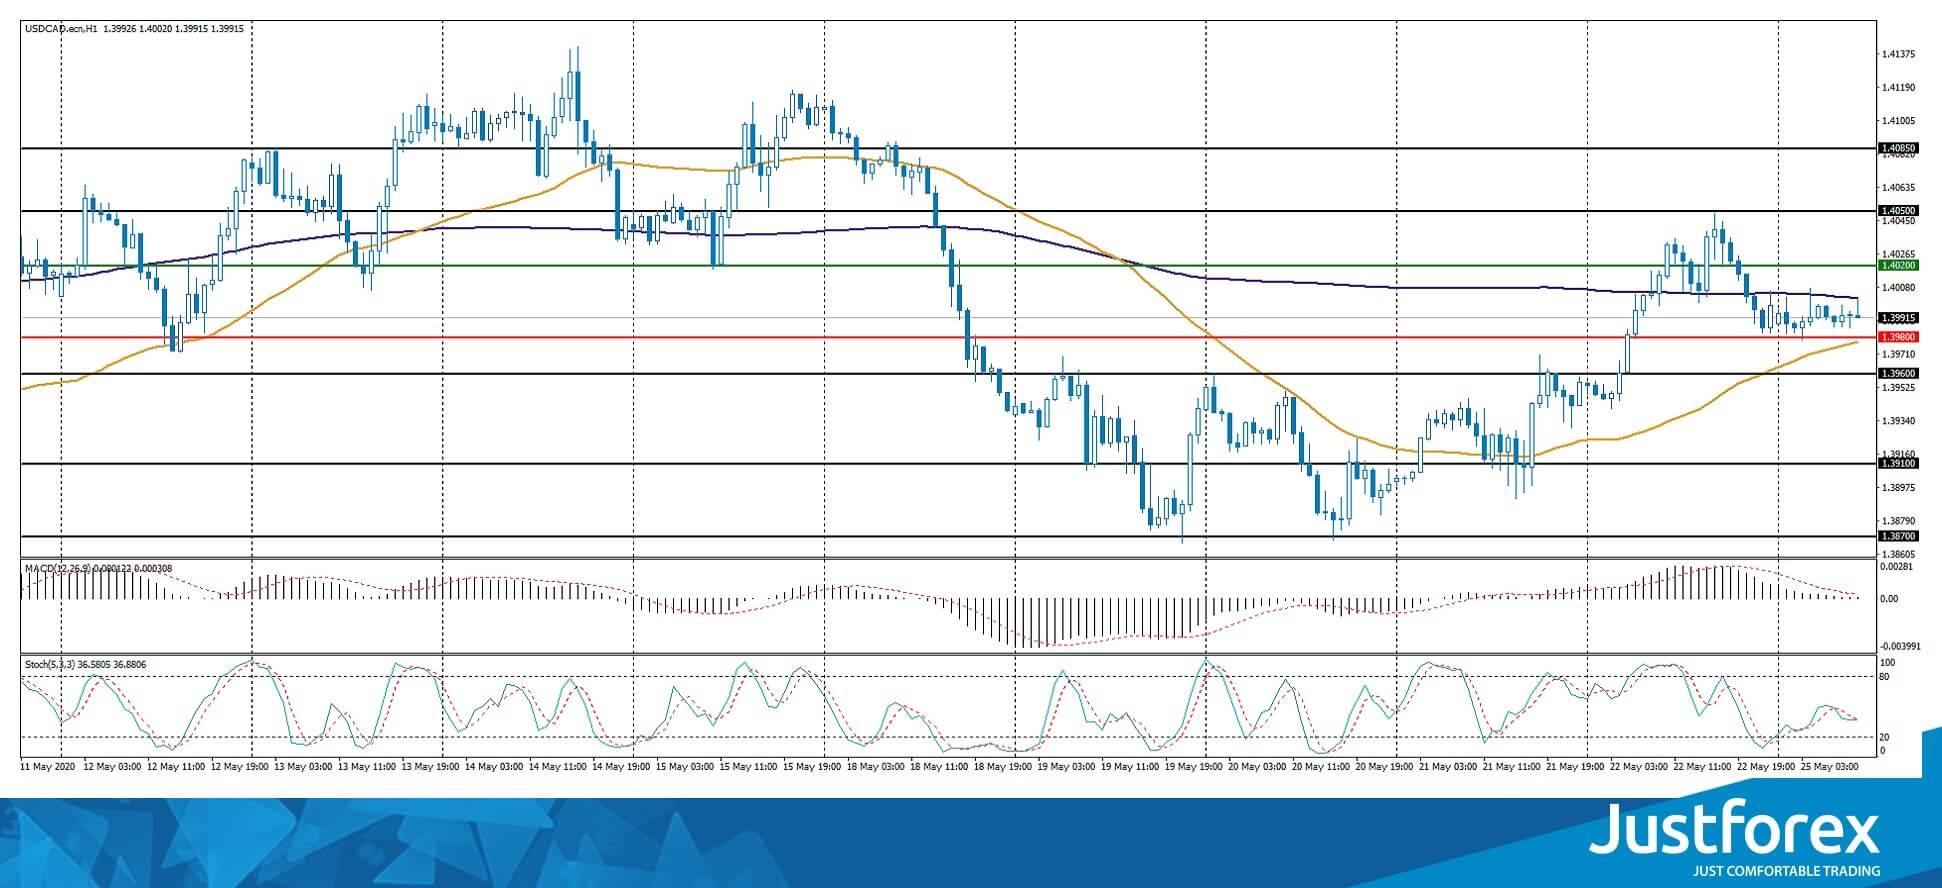
Indicators do not give accurate signals: the price has fixed between 50 MA and 100 MA.
The MACD histogram is near the 0 mark.
Stochastic Oscillator is in the neutral zone, the %K line has crossed the %D line. There are no signals at the moment.
Trading recommendations
Support levels: 1.3980, 1.3960, 1.3910
Resistance levels: 1.4020, 1.4050, 1.4085
If the price fixes below 1.3980, a further drop in USD/CAD quotes is expected. The movement is tending to 1.3940-1.3920.
An alternative could be the growth of the USD/CAD currency pair to 1.4050-1.4080.
The USD/JPY currency pair
Technical indicators of the currency pair:
Prev Open: 107.634
Open: 107.572
% chg. over the last day: -0.03
Day’s range: 107.541 – 107.780
52 wk range: 101.19 – 112.41
The USD/JPY currency pair continues to consolidate. The technical pattern is ambiguous. Currently, the local support and resistance levels are 107.60 and 107.85, respectively. The conflict between the US and China is in the spotlight. Demand for “safe haven” currencies is still at a fairly high level. Positions should be opened from key levels.
Today, the news feed on Japan’s economy is calm.
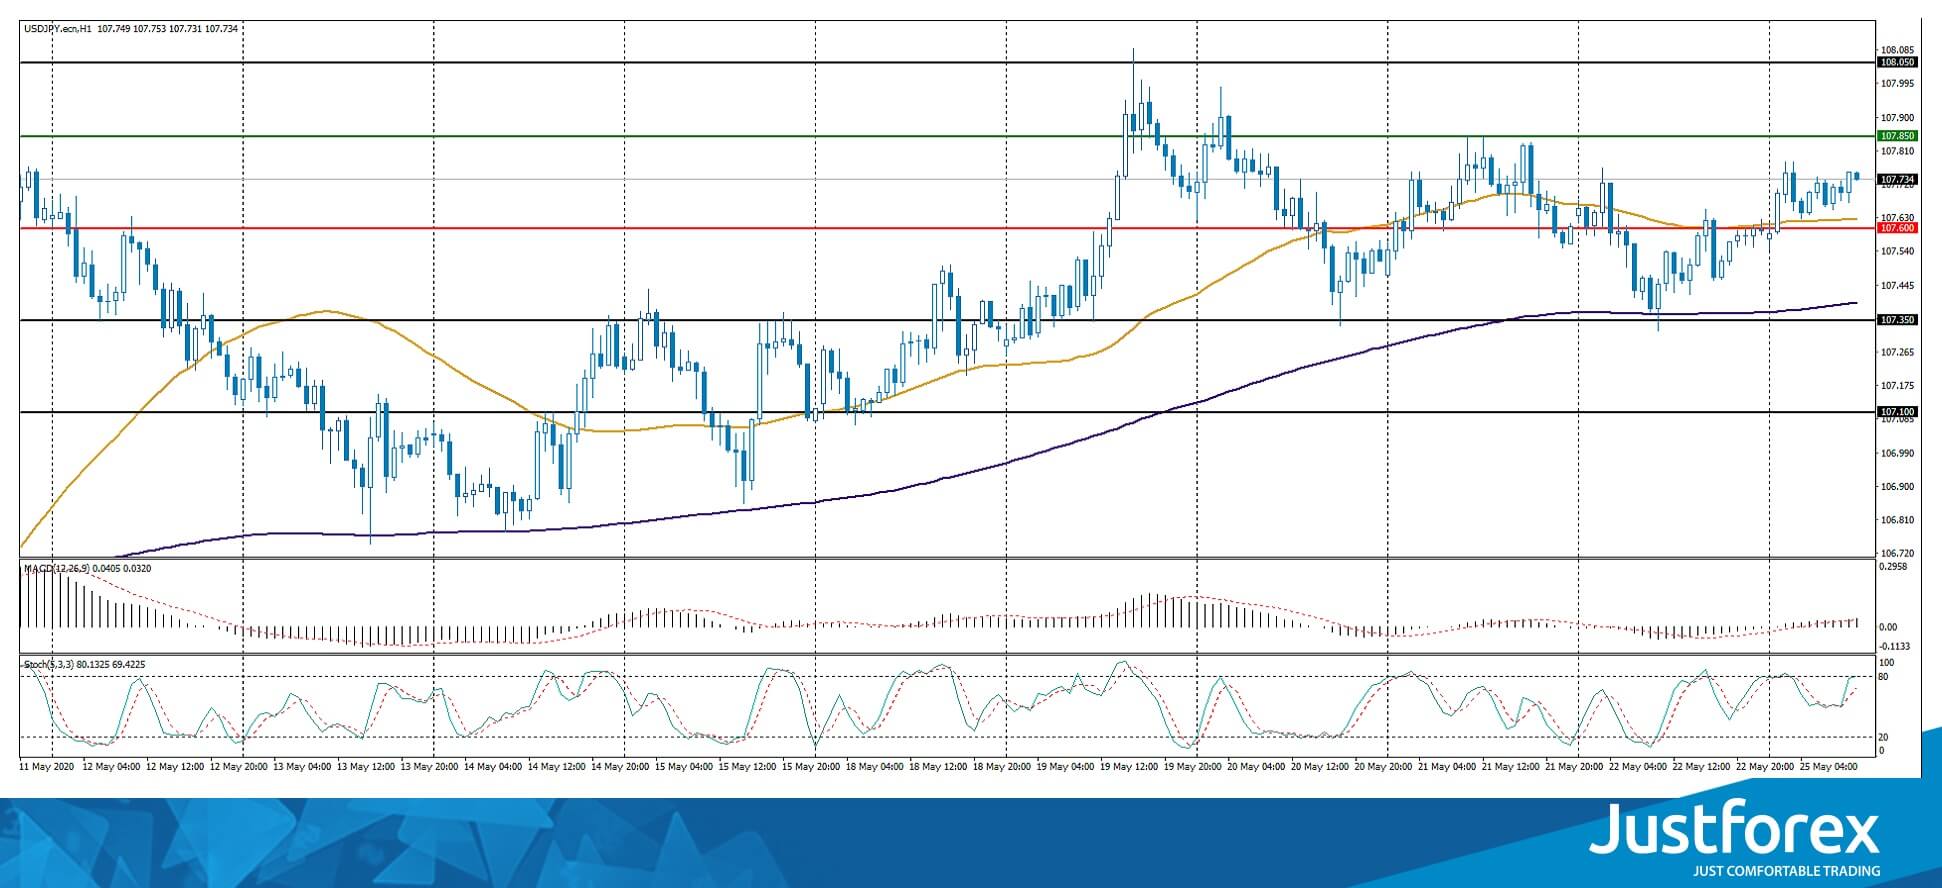
Indicators do not give accurate signals: the price has crossed 50 MA.
The MACD histogram has started rising, indicating the bullish sentiment.
Stochastic Oscillator is in the neutral zone, the %K line is above the %D line, which gives a signal to buy USD/JPY.
Trading recommendations
Support levels: 107.60, 107.35, 107.10
Resistance levels: 107.85, 108.05
If the price fixes above 107.85, USD/JPY quotes are expected to rise. The movement is tending to 108.10-108.30.
An alternative could be a decrease in the USD/JPY currency pair to 107.40-107.20.


