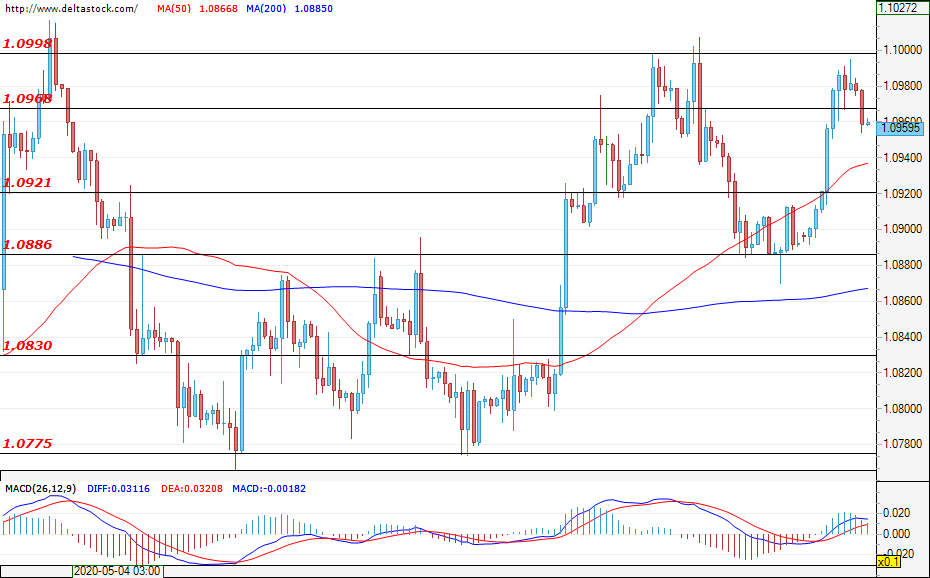
EUR/USD
Current level – 1.0959
The euro gained some ground against the USD during yesterday’s session and the price tested the resistance zone at 1.0998 but could not break it. A continuation of the positive move could lead to another attempt for a breakthrough at 1.0998 which, if successful, could easily pave the way towards further gains, targeting the highs at around 1.1078. If bears take control, the EUR/USD could try to break through the support zone at 1.0920, followed by the one at 1.0886, thus confirming expectations for a range-bound trading between 1.0770-1.1000.
| Resistance | Support | ||
| intraday | intraweek | intraday | intraweek |
| 1.0970 | 1.1000 | 1.0920 | 1.0770 |
| 1.0998 | 1.1080 | 1.0880 | 1.0650 |
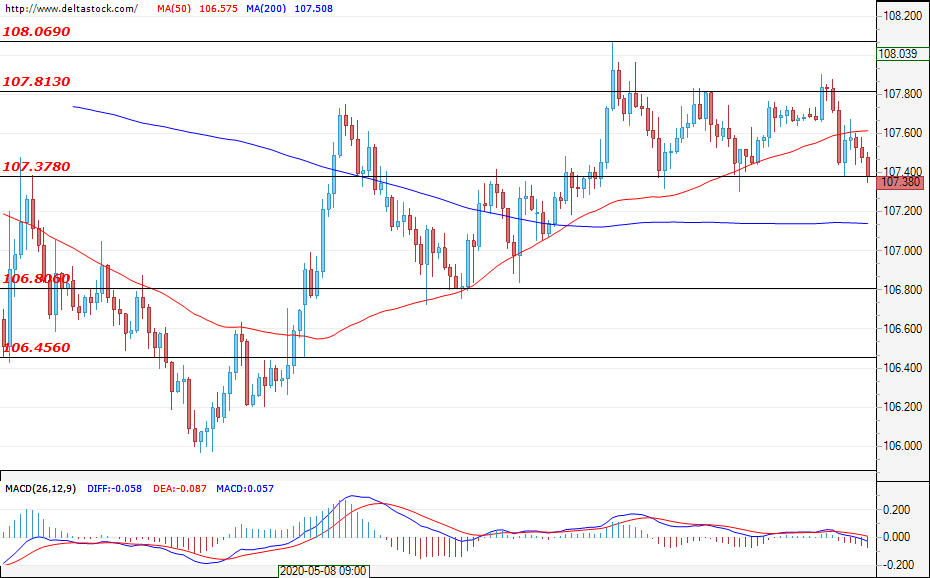
USD/JPY
Current level – 107.38
The currency pair continues its struggle to break through the border of the narrow range between 107.37 and 107.81. At the time of writing, the USD/JPY is trading at the support at 107.37 and, if the bears manage to break this level, the downward move will probably gain momentum towards the next targets at 106.80, followed by 106.45. In an upward direction, only a violation of the resistance level at 107.81 and the next one at 108.06 could lead to an improvement in market sentiment and future gains.
| Resistance | Support | ||
| intraday | intraweek | intraday | intraweek |
| 107.80 | 109.20 | 107.37 | 106.80 |
| 108.00 | 110.00 | 106.80 | 106.45 |
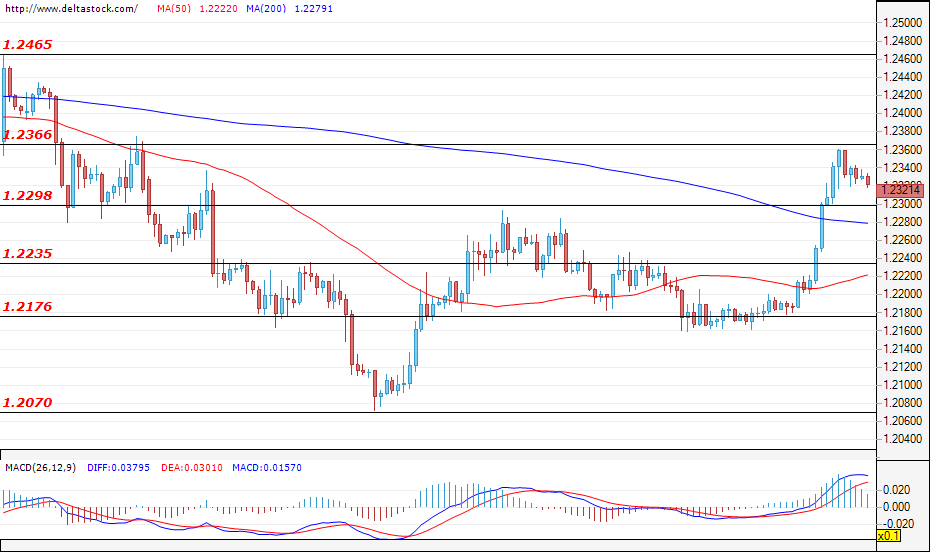
GBP/USD
Current level – 1.2321
During yesterday’s rally the currency pair successfully violated the resistance at 1.2298 and tested the one at 1.2366, which is where the bullish momentum faded. The cable is currently consolidating at around 1.2321 and, if it manages to hold above 1.2298, further gains towards 1.2366 are to be expected. If the latter does not hold, the most probable scenario will be a continuation of the move towards 1.2465. In the negative direction, the first support lies at 1.2298, followed by the one at 1.2235.
| Resistance | Support | ||
| intraday | intraweek | intraday | intraweek |
| 1.2366 | 1.2365 | 1.2298 | 1.2176 |
| 1.2465 | 1.2465 | 1.2235 | 1.2070 |