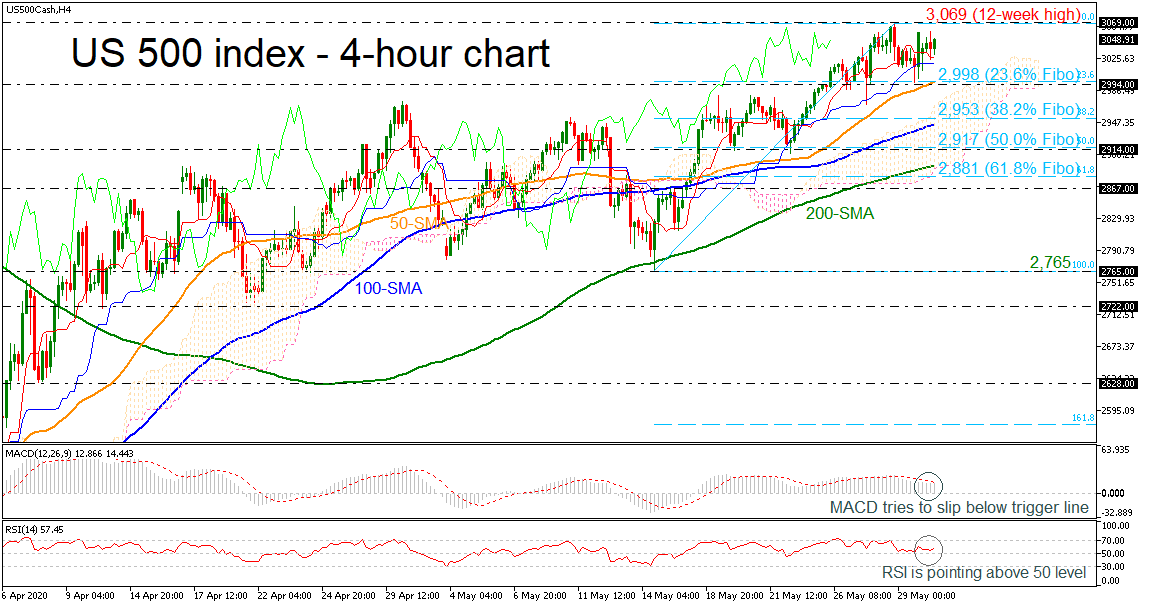
The US 500 (cash) index is looking more neutral as prices have climbed towards the 12-week high of 3,069, remaining above the 23.6% Fibonacci retracement level of the up leg from 2,765 to 3,069 at 2,998 and the 50-period simple moving average (SMA).
The technical indicators seem to be in contrast as the MACD is moving below the trigger line in the positive zone, while the RSI, standing above 50 level, is pointing upwards.
In case of an upside move, immediate resistance may come from the 3,069 barrier, while the stronger 3,140 – 3,205 area could halt bullish movements.
Alternatively, a drop below the red Tenkan-sen and the blue Kijun-sen lines could send prices until the 23.6% Fibo of 2,998, which stands near the 2,994 barrier. Clearing these levels, the 2,953 obstacle, being the 38.2% Fibo and the 100-period SMA at 2,946 could be the next hurdles to watch.
In conclusion, if the price surpasses the 12-week high, it could endorse the positive outlook in the broader picture, however, a decline below the 100-period SMA could shift the bias to negative.