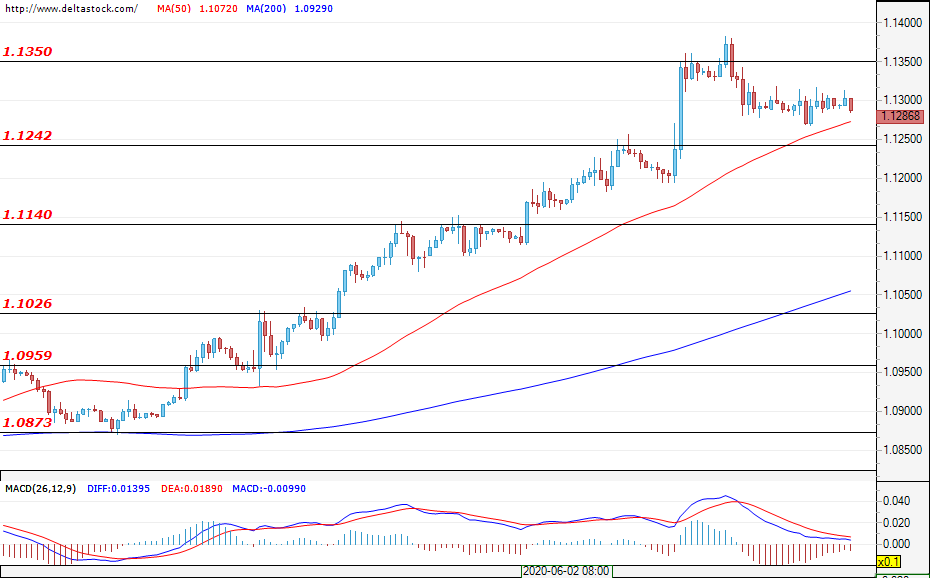
EUR/USD
Current level – 1.1291
The rally from Friday was limited under the resistance zone at 1.1350 and now the currency pair consolidated around the current price at 1.1291. Bullish sentiments are still intact and а new test of the aforementioned zone is highly probable. Success here, could easily point the EUR to new future gains against the US dollar. If bears take control, the first support lies at 1.1200, followed by 1.1140. High volatility is expected on Thursday 18:30 CEET when the Fed Interest Rates decision is awaited.
| Resistance | Support | ||
| intraday | intraweek | intraday | intraweek |
| 1.1350 | 1.1400 | 1.1240 | 1.1140 |
| 1.1400 | 1.1510 | 1.1200 | 1.1020 |
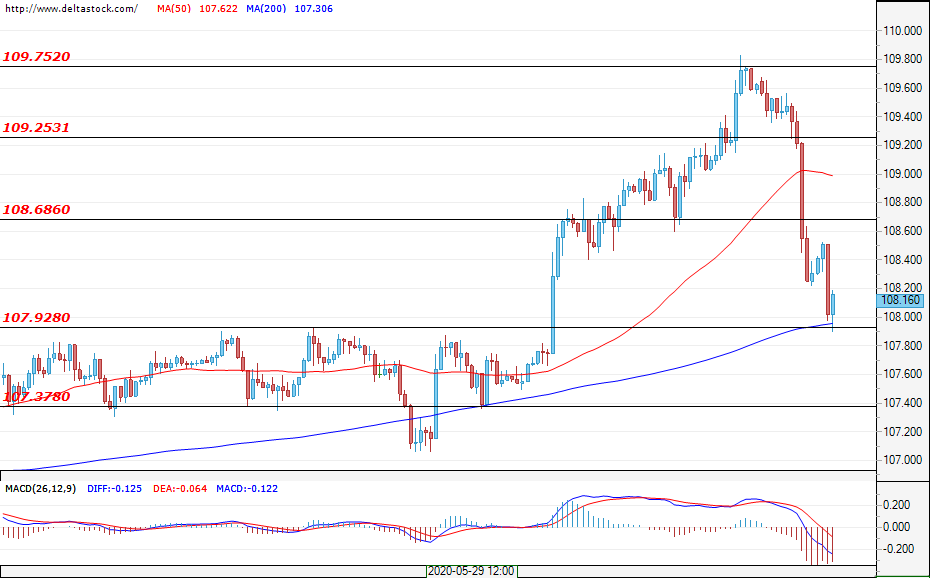
USD/JPY
Current level – 108.16
In the early hours of todays’ session the pair made a precise test of the 107.90 support zone which, as expected, proved to be reliable. Price action is still dominated by the bulls, as long as prices are above 107.90. If the pair manages to bottom around these levels, 107.90 can be considered as a static support and bulls could try to reach the highs at around 109.75. However, it is possible for them to face some difficulties around the local resistance levels at 108.70 and 109.25.
| Resistance | Support | ||
| intraday | intraweek | intraday | intraweek |
| 109.94 | 110.00 | 107.90 | 107.37 |
| 111.50 | 111.64 | 107.90 | 106.80 |
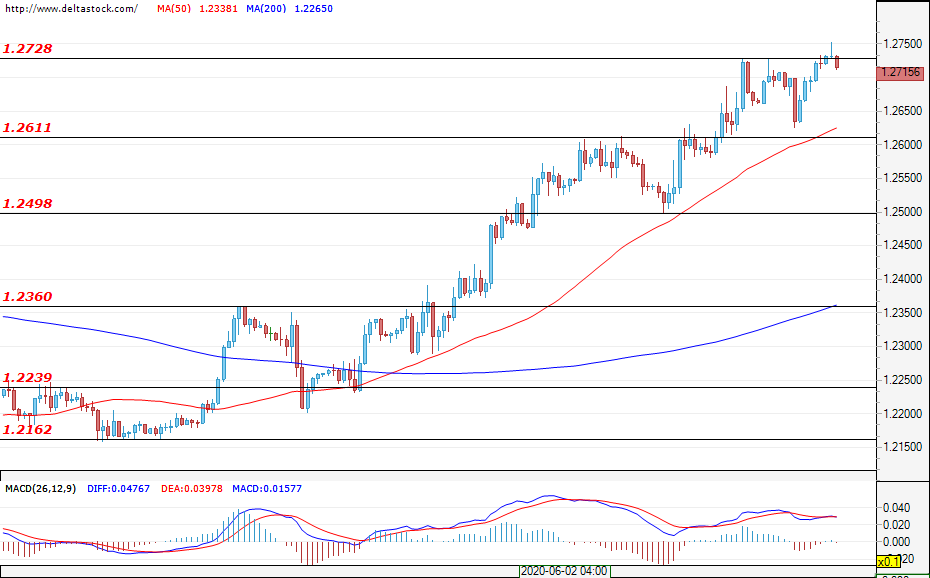
GBP/USD
Current level – 1.2697
Similar to the other currency pairs, here the USD is once again losing positions. The price of GBP managed to breach the resistance level at 1.2638 and continues its positive run, heading to the upper important zone at 1.2800 from the bigger time frames. There a breach could pave the way for the Cable to the highs from the end of February and beginning of March around 1.3200. If bears enter the market, the first important support level for them lies at 1.2523, followed by the lower one at 1.2465.
| Resistance | Support | ||
| intraday | intraweek | intraday | intraweek |
| 1.2730 | 1.2880 | 1.2610 | 1.2360 |
| 1.2825 | 1.3000 | 1.2500 | 1.2290 |