
The EUR/USD currency pair
Technical indicators of the currency pair:
Prev Open: 1.13387
Open: 1.13746
% chg. over the last day: +0.26
Day’s range: 1.13241 – 1.13953
52 wk range: 1.0777 – 1.1494
The EUR/USD currency pair continues to consolidate. There is no defined trend. Investors assess the results of the Fed meeting. The regulator does not plan to raise interest rates, at least until the end of 2022. The Central Bank intends to continue to support the national economy, which has been suffered significantly by the COVID-19 pandemic. The Fed forecasts a 6.5% reduction in the country’s GDP this year. At the moment, the key range is 1.1320-1.1400. Today, we expect important economic releases from the US. Positions should be opened from key levels.
The Economic News Feed for 2020.06.11:
Initial jobless claims in the US at 15:30 (GMT+3:00);
US producer price index at 15:30 (GMT+3:00).
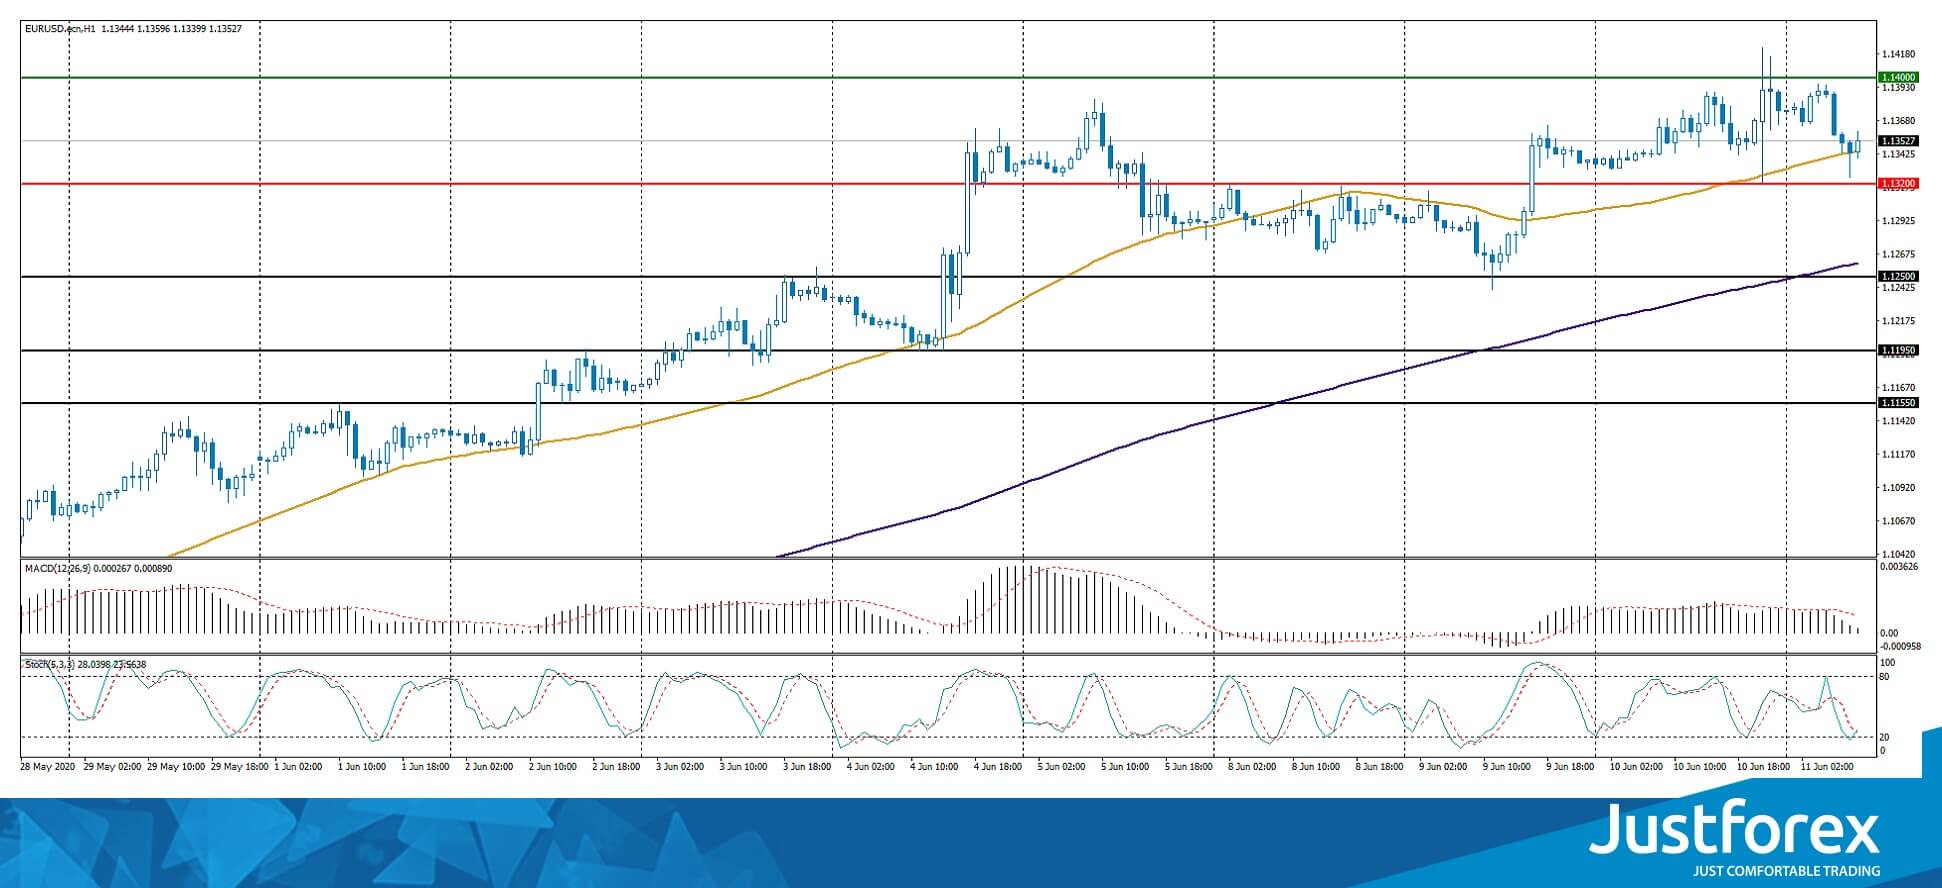
Indicators do not give accurate signals: the price is testing 50 MA.
The MACD histogram is near the 0 mark.
Stochastic Oscillator is in the neutral zone, the %K line has crossed the %D line. There are no signals at the moment.
Trading recommendations
Support levels: 1.1320, 1.1250, 1.1195
Resistance levels: 1.1400, 1.1450, 1.1500
If the price fixes above the round level of 1.1400, further growth of EUR/USD quotes is expected. The movement is tending to 1.1440-1.1460.
An alternative could be a decrease in the EUR/USD currency pair to 1.1270-1.1240.
The GBP/USD currency pair
Technical indicators of the currency pair:
Prev Open: 1.27259
Open: 1.27450
% chg. over the last day: +0.13
Day’s range: 1.26510 – 1.27545
52 wk range: 1.1466 – 1.3516
GBP/USD quotes have become stable after prolonged growth. At the moment, the technical pattern is ambiguous. Financial market participants assess the Fed meeting. The key support and resistance levels are 1.2640 and 1.2730, respectively. Correction of the trading instrument is possible in the near future. We recommend opening positions from key levels.
The news feed on the UK economy is calm.
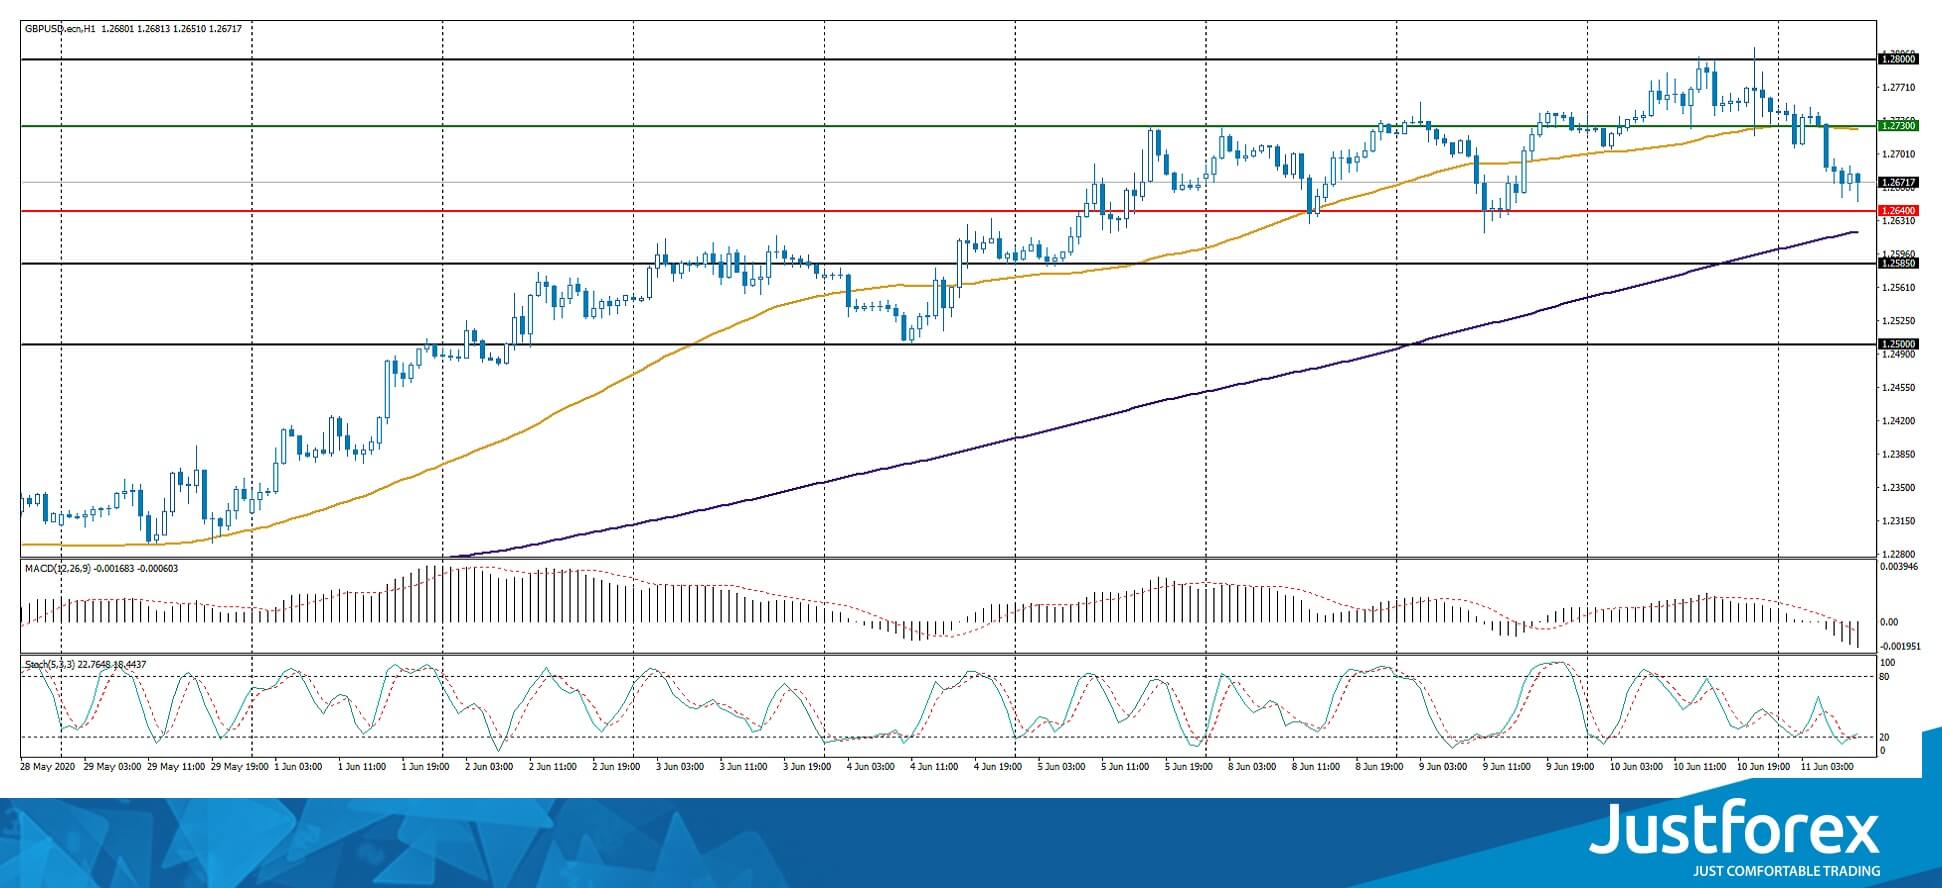
Indicators do not give accurate signals: the price has fixed between 50 MA and 100 MA.
The MACD histogram has moved into the negative zone, which indicates the development of the correction movement.
Stochastic Oscillator is near the oversold zone, the %K line has crossed the %D line. There are no signals at the moment.
Trading recommendations
Support levels: 1.2640, 1.2585, 1.2500
Resistance levels: 1.2730, 1.2800
If the price fixes above 1.2730, GBP/USD purchases should be considered. The movement is tending to 1.2800-1.2830.
An alternative could be a decrease in the GBP/USD currency pair to 1.2580-1.2550.
The USD/CAD currency pair
Technical indicators of the currency pair:
Prev Open: 1.34166
Open: 1.34115
% chg. over the last day: -0.01
Day’s range: 1.33973 – 1.34984
52 wk range: 1.2949 – 1.4668
The loonie is being traded in a flat. There is no defined trend. At the moment, USD/CAD quotes are testing the “mirror” resistance of 1.3490. The 1.3425 mark is the nearest support. The USD/CAD currency pair is tending to recover after a prolonged fall. We recommend paying attention to the dynamics of oil quotes. Positions should be opened from key levels.
Today, the publication of important economic releases from Canada is not expected.
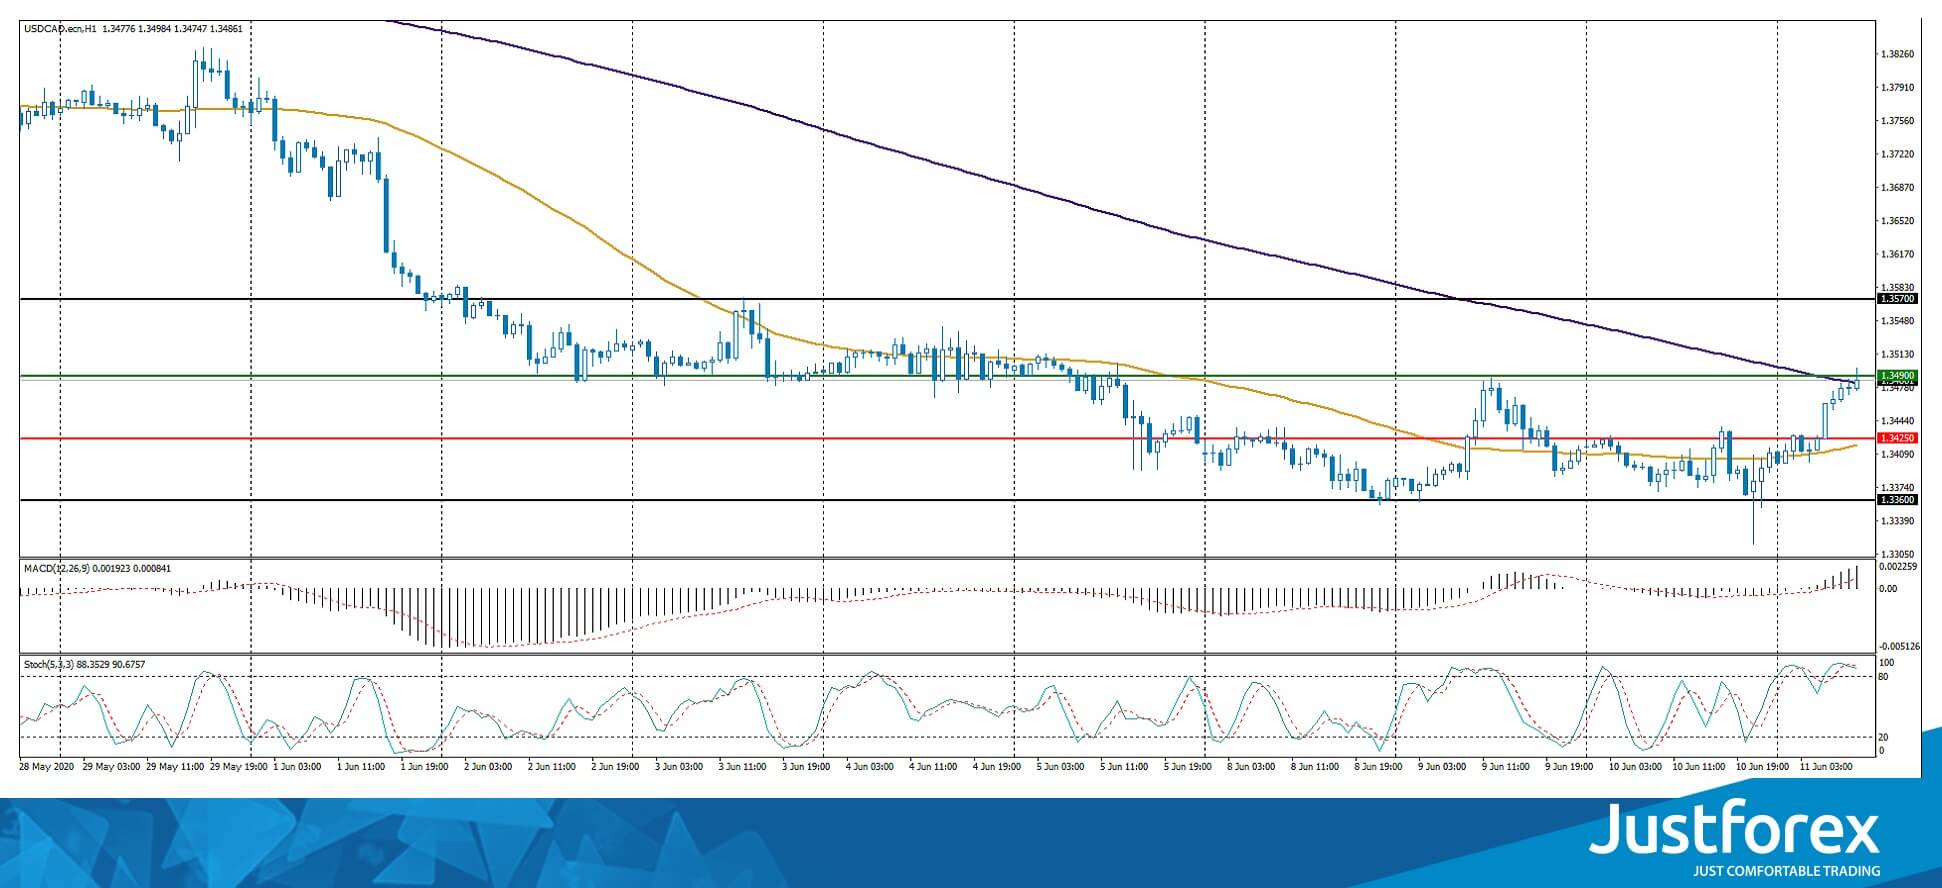
Indicators do not give accurate signals: the price has crossed 100 MA.
The MACD histogram has moved into the positive zone, which indicates the development of bullish sentiment.
Stochastic Oscillator is in the overbought zone, the %K line has crossed the %D line. There are no signals at the moment.
Trading recommendations
Support levels: 1.3425, 1.3360, 1.3300
Resistance levels: 1.3490, 1.3570
If the price fixes above 1.3490, USD/CAD quotes are expected to correct. The movement is tending to 1.3550-1.3580.
An alternative could be a decrease in the USD/CAD currency pair to 1.3370-1.3340.
The USD/JPY currency pair
Technical indicators of the currency pair:
Prev Open: 107.727
Open: 107.087
% chg. over the last day: -0.58
Day’s range: 106.896 – 107.235
52 wk range: 101.19 – 112.41
The USD/JPY currency pair continues to show a steady downtrend. The trading instrument has updated local lows again. USD/JPY quotes have found support at the level of 106.90. The 107.25 mark is the nearest resistance. The further growth of the yen against the greenback is possible. We recommend paying attention to economic reports from the US. Positions should be opened from key levels.
The news feed on Japan’s economy is calm.
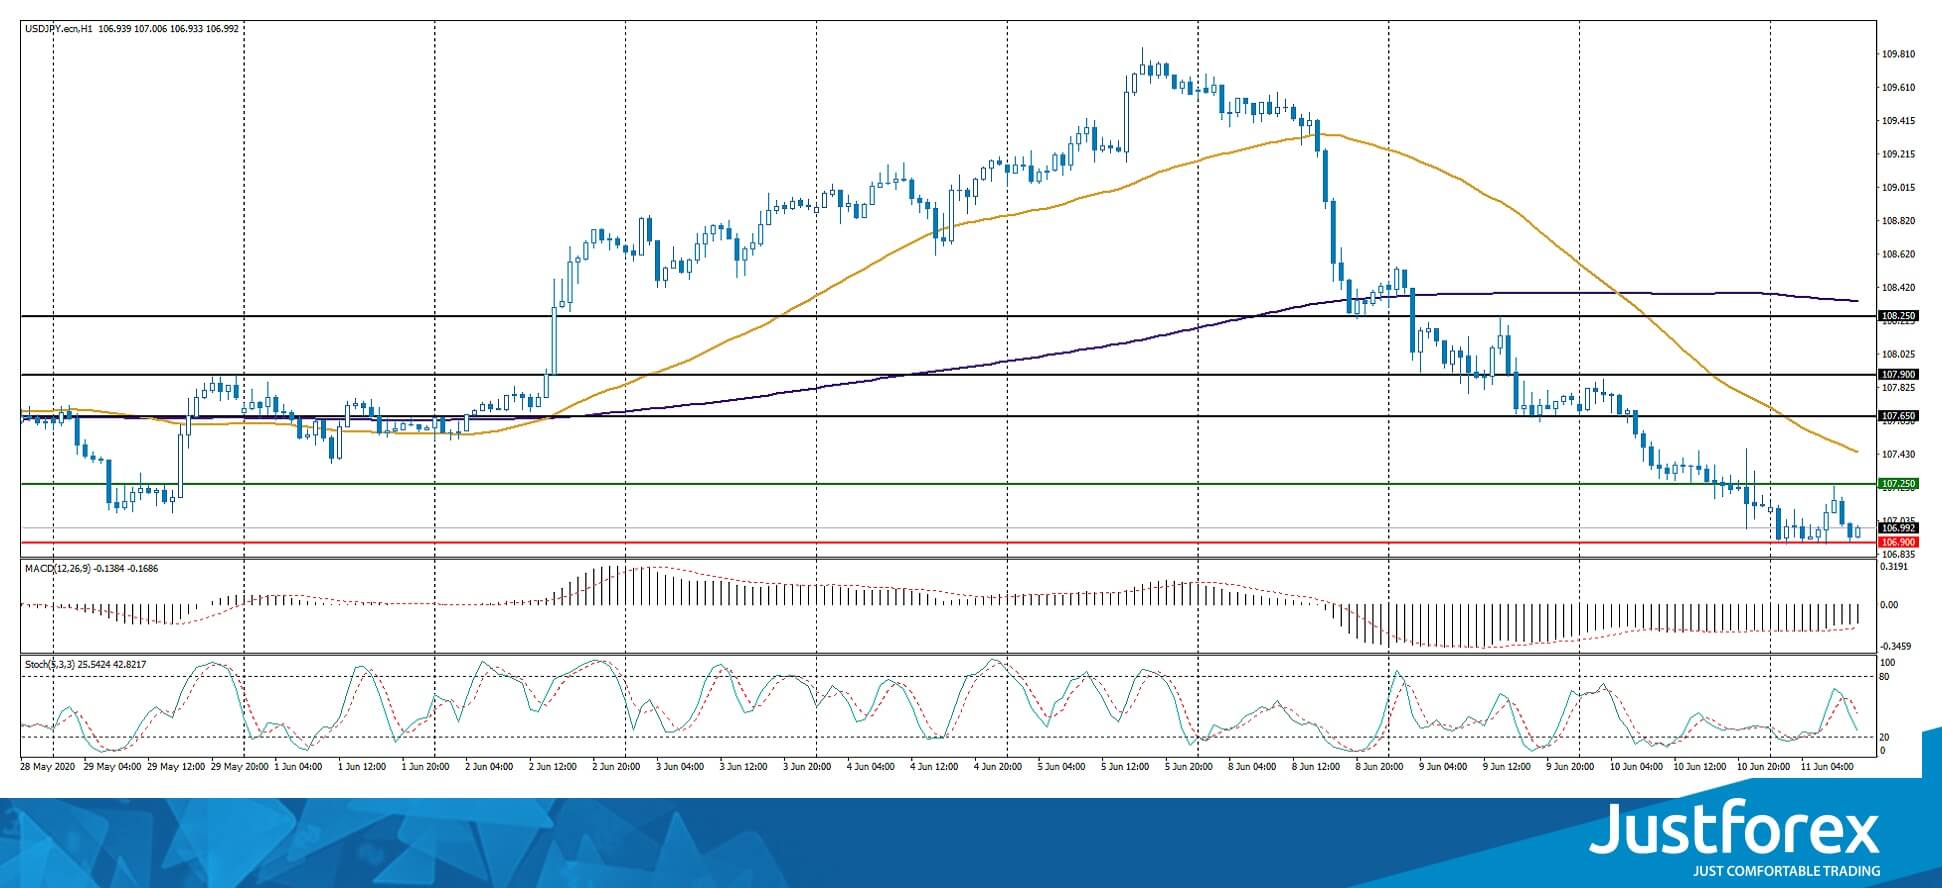
Indicators signal the power of sellers: the price has fixed below 50 MA and 100 MA.
The MACD histogram is in the negative zone, indicating the bearish sentiment.
Stochastic Oscillator is in the neutral zone, the %K line is below the %D line, which gives a signal to sell USD/JPY.
Trading recommendations
Support levels: 106.90, 106.50
Resistance levels: 107.25, 107.65, 107.90
If the price fixes below 106.90, a further drop in USD/JPY quotes is expected. The movement is tending to 106.50-106.30.
An alternative could be the growth of the USD/JPY currency pair to 107.60-107.80.


